The incident. A "top 3 lessons per course" report used GROUP BY course with MAX(rating), which returned one number per course and lost the lessons. A second attempt joined the table to itself and ran for 40 minutes on a million rows. A window function does it in one sorted pass.
You already know: GROUP BY and aggregates (Aggregation); sorting and heaps (Data structures).
1. Windows: aggregates that don't collapse rows
The question. How do you compute a per-group value but keep every row?
Start from nothing. A window function computes over a set of rows related to the current row, defined by OVER (PARTITION BY ... ORDER BY ... frame), and returns one value per row instead of one per group. PARTITION BY splits rows into groups (like GROUP BY without collapsing); ORDER BY orders rows inside each partition; the frame (e.g., ROWS BETWEEN 6 PRECEDING AND CURRENT ROW) chooses which rows feed the calculation. With ORDER BY and no explicit frame, aggregates run from the partition start to the current row: a running total.
import sqlite3

db = sqlite3.connect(":memory:")
db.executescript("""
CREATE TABLE study (student TEXT, day TEXT, minutes INT);
INSERT INTO study VALUES ('asha','2026-03-01',30),('asha','2026-03-02',45),('asha','2026-03-03',20),('asha','2026-03-05',60),
 ('ben','2026-03-01',10),('ben','2026-03-02',50),('ben','2026-03-04',40);
""")
q = """
SELECT student, day, minutes,
       SUM(minutes) OVER (PARTITION BY student ORDER BY day) AS running_total,
       ROUND(AVG(minutes) OVER (PARTITION BY student ORDER BY day ROWS BETWEEN 2 PRECEDING AND CURRENT ROW), 1) AS avg_last3,
       minutes - LAG(minutes) OVER (PARTITION BY student ORDER BY day) AS change_vs_prev,
       ROUND(100.0 * minutes / SUM(minutes) OVER (PARTITION BY student), 1) AS pct_of_student_total
FROM study ORDER BY student, day
"""
for row in db.execute(q):
    print(row)
Each row keeps its own values and gains context: its running total, a 3-row moving average, the change from the previous row (LAG), and its share of the student's total, all in one query.
The frame bug that ships to dashboards: ROWS vs RANGE. A "rolling 3-day total" is often written as ROWS BETWEEN 2 PRECEDING AND CURRENT ROW. That means the last three rows, which equals the last three days only if there's a row for every day. Real activity data has gaps:
import sqlite3

db = sqlite3.connect(":memory:")
db.executescript("""
CREATE TABLE study (day TEXT, minutes INT);
INSERT INTO study VALUES ('2026-03-01',30),('2026-03-02',45),('2026-03-03',20),('2026-03-07',60),('2026-03-08',10);
""")
q = """
SELECT day, minutes,
       SUM(minutes) OVER (ORDER BY day ROWS BETWEEN 2 PRECEDING AND CURRENT ROW) AS last_3_rows,
       SUM(minutes) OVER (ORDER BY julianday(day) RANGE BETWEEN 2 PRECEDING AND CURRENT ROW) AS last_3_days
FROM study ORDER BY day"""
for row in db.execute(q):
    print(row)
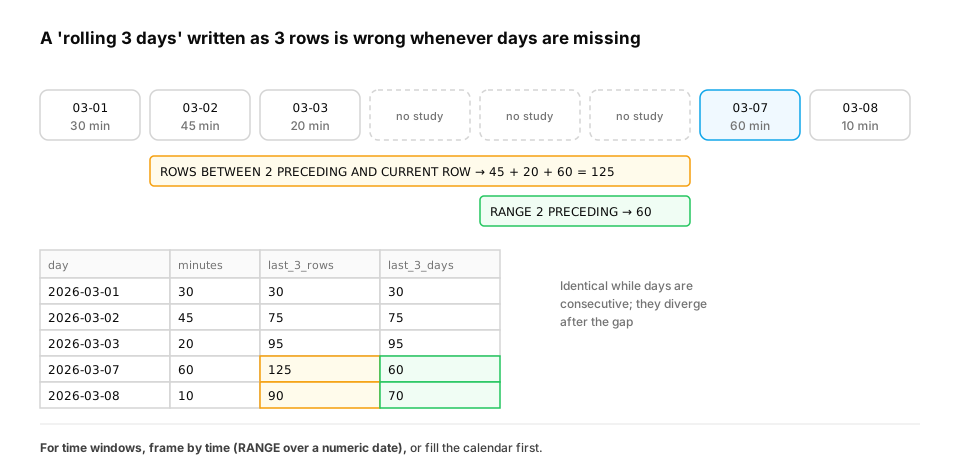
For the first three days the two columns agree (30, 75, 95). On 7 March they split: the row-based frame reaches back to 2 and 3 March and reports 125, while the day-based frame sees only that day, 60. On 8 March it's 90 vs 70. RANGE with a numeric offset (here over julianday) frames by value, so it counts days whether or not rows exist.
In production. Rolling features (7-day spend, 30-day active days) are among the most common inputs to ML models, and the row-vs-time mistake makes a feature mean different things for active and inactive users, exactly the users a churn model needs to tell apart. PostgreSQL supports
RANGE BETWEEN INTERVAL '6 days' PRECEDING AND CURRENT ROWdirectly on timestamps. When a database can't frame by time, fill the calendar first (Aggregation) so every day has a row.
From production
A churn model uses SUM(spend) OVER (PARTITION BY user ORDER BY day ROWS BETWEEN 6 PRECEDING AND CURRENT ROW) as '7-day spend'. The events table only has rows for days with activity.
What does the feature actually measure for an occasional user who buys every other week?
Show the answer
D. Their spend over their last 7 active days, which can stretch back months, so inactive users look as engaged as active ones — ROWS counts rows, not days. For sparse users, the last 7 rows span far more than a week. Frame by time (RANGE with a date offset) or densify the calendar so the window means what its name says.
2. Ranking and top-N per group
The question. How do you get the top 3 lessons in each course?
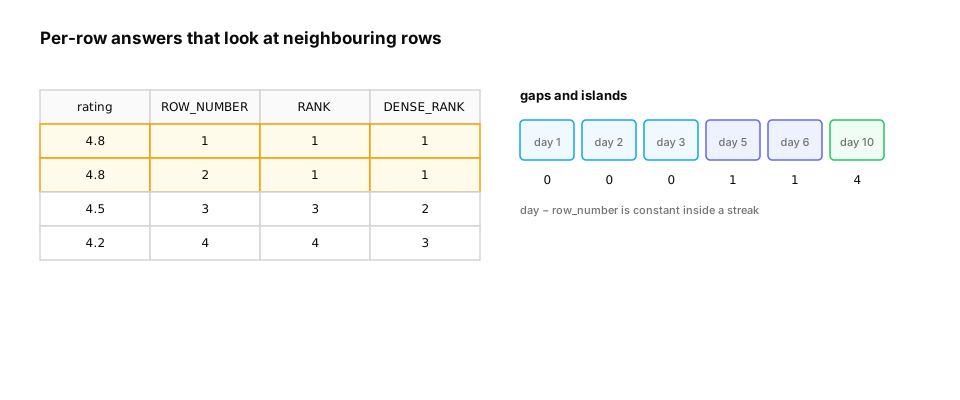
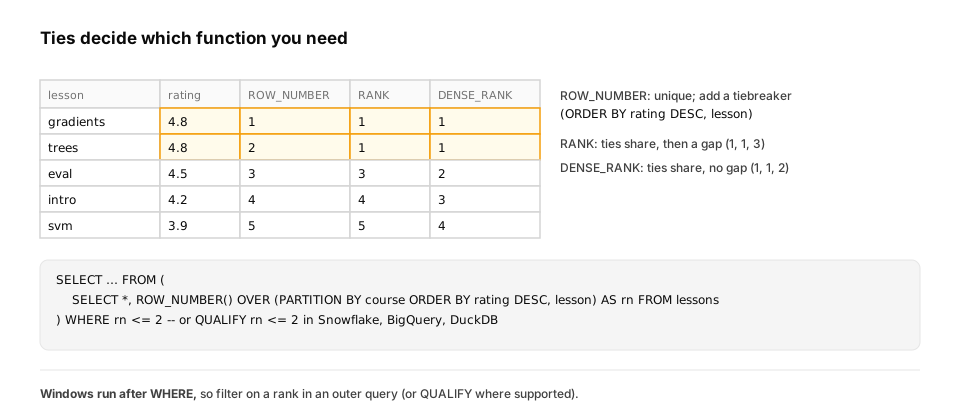
Start from nothing. Ranking functions number rows within each partition: ROW_NUMBER() gives unique numbers (ties broken arbitrarily unless you add a tiebreaker), RANK() gives ties the same rank and leaves gaps (1, 1, 3), DENSE_RANK() gives ties the same rank without gaps (1, 1, 2). Top-N per group is: rank in a subquery or CTE, then filter WHERE rank <= N (window functions can't appear in WHERE directly, because they're computed after it).
import sqlite3

db = sqlite3.connect(":memory:")
db.executescript("""
CREATE TABLE lessons (course TEXT, lesson TEXT, rating REAL);
INSERT INTO lessons VALUES ('ML101','intro',4.2),('ML101','gradients',4.8),('ML101','trees',4.8),('ML101','svm',3.9),('ML101','eval',4.5),
 ('SQL1','select',4.0),('SQL1','joins',4.6),('SQL1','windows',4.9);
""")
q = """
SELECT course, lesson, rating,
       ROW_NUMBER() OVER w AS row_num, RANK() OVER w AS rnk, DENSE_RANK() OVER w AS dense
FROM lessons WINDOW w AS (PARTITION BY course ORDER BY rating DESC)
ORDER BY course, rating DESC
"""
for row in db.execute(q):
    print(row)
top2 = """
SELECT course, lesson, rating FROM (
    SELECT *, ROW_NUMBER() OVER (PARTITION BY course ORDER BY rating DESC, lesson) AS rn FROM lessons
) WHERE rn <= 2 ORDER BY course, rn
"""
print("top 2 per course:", db.execute(top2).fetchall())
The tie between gradients and trees shows the difference: ROW_NUMBER picks one arbitrarily (so the query adds lesson as a deterministic tiebreaker), RANK and DENSE_RANK keep them equal. Choose based on whether ties should both appear in a "top N".
In production. The single most common use of ROW_NUMBER in data engineering is deduplication: "keep the latest version of each record". Change-data-capture feeds and event streams deliver the same entity many times, and
ROW_NUMBER() OVER (PARTITION BY id ORDER BY updated_at DESC) = 1keeps the current one. Snowflake, BigQuery and DuckDB add aQUALIFYclause that filters on a window result directly (QUALIFY rn = 1), saving the outer query. Always give ORDER BY a deterministic tiebreaker, or two runs of the same job can keep different rows.
Quick check
You want each student's most recent event, exactly one row per student. Which approach is correct?
Show the answer
D. ROW_NUMBER() OVER (PARTITION BY student ORDER BY ts DESC, event_id DESC) in a subquery, then keep rn = 1 — ROW_NUMBER per student with a deterministic tiebreaker returns exactly one full row each. GROUP BY with a non-aggregated column returns an arbitrary event in many databases, and RANK without a partition ranks globally.
3. Gaps and islands: streaks
The question. What is each student's longest run of consecutive study days?
Start from nothing. This classic pattern groups consecutive values into islands. Number each student's days in order with ROW_NUMBER; for consecutive dates, the date minus that number is constant within a run and changes after a gap. Group by that difference to get each island's start, end and length.
import sqlite3

db = sqlite3.connect(":memory:")
db.execute("CREATE TABLE study_days (student TEXT, day TEXT)")
days = {"asha": ["2026-03-01", "2026-03-02", "2026-03-03", "2026-03-05", "2026-03-06", "2026-03-10"],
        "ben": ["2026-03-01", "2026-03-04", "2026-03-05", "2026-03-06", "2026-03-07"]}
db.executemany("INSERT INTO study_days VALUES (?, ?)", [(s, d) for s, ds in days.items() for d in ds])
q = """
WITH numbered AS (
    SELECT student, day,
           julianday(day) - ROW_NUMBER() OVER (PARTITION BY student ORDER BY day) AS island
    FROM study_days
),
islands AS (
    SELECT student, MIN(day) AS start, MAX(day) AS finish, COUNT(*) AS length FROM numbered GROUP BY student, island
)
SELECT student, start, finish, length,
       RANK() OVER (PARTITION BY student ORDER BY length DESC) AS streak_rank
FROM islands ORDER BY student, start
"""
for row in db.execute(q):
    print(row)
Asha has three streaks (3, 2 and 1 days); Ben's longest is 4 days. The same trick finds sessions in clickstreams, outage windows in monitoring data, and runs of failed logins.
A real-world example: sessionizing a clickstream. Web and app analytics group events into sessions: a new session starts when a user has been idle for more than some threshold (30 minutes is a common convention). It's the islands idea with timestamps. LAG measures the gap to the previous event, a flag marks gaps over the threshold, and a running SUM of the flags numbers the sessions:
import sqlite3

db = sqlite3.connect(":memory:")
db.execute("CREATE TABLE clicks (user TEXT, ts TEXT)")
db.executemany("INSERT INTO clicks VALUES (?, ?)", [
    ("asha", "2026-03-01 09:00"), ("asha", "2026-03-01 09:05"), ("asha", "2026-03-01 09:20"),
    ("asha", "2026-03-01 11:00"), ("asha", "2026-03-01 11:10"),
    ("ben",  "2026-03-01 09:00"), ("ben",  "2026-03-01 10:15")])
q = """
WITH gaps AS (
    SELECT user, ts,
           (julianday(ts) - julianday(LAG(ts) OVER (PARTITION BY user ORDER BY ts))) * 24 * 60 AS gap_min
    FROM clicks
),
flagged AS (
    SELECT user, ts, CASE WHEN gap_min IS NULL OR gap_min > 30 THEN 1 ELSE 0 END AS new_session FROM gaps
),
sessions AS (
    SELECT user, ts, SUM(new_session) OVER (PARTITION BY user ORDER BY ts) AS session_no FROM flagged
)
SELECT user, session_no, MIN(ts), MAX(ts), COUNT(*) AS clicks
FROM sessions GROUP BY user, session_no ORDER BY user, session_no"""
for row in db.execute(q):
    print(row)
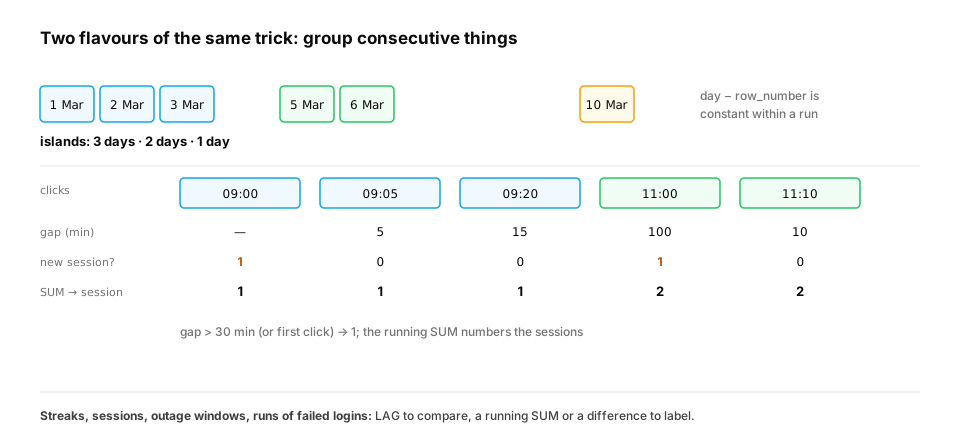
Asha's five clicks become two sessions: 09:00–09:20 with 3 clicks, then 11:00–11:10 with 2 clicks after a 100-minute gap. Ben's clicks are 75 minutes apart, so each is its own one-click session. The first event per user has no previous row (LAG returns NULL), which is why the flag treats NULL as "new session".
In production. Sessions feed product metrics (session length, sessions per user) and ML features. The same LAG-and-flag pattern detects outage windows in monitoring data, runs of failed logins for fraud rules, and turns in a chat log into conversations. The threshold is a product decision, not a law of nature. Make it a named parameter, and test what happens exactly at the boundary (here, a gap of exactly 30 minutes stays in the same session).
From production
A sessionization query flags gap_min > 30 as a new session, but every user's very first click is assigned session 0, and some dashboards show 'session 0' as a separate bucket.
What's the cause and fix?
Show the answer
B. LAG returns NULL for the first event, so NULL > 30 is UNKNOWN and the CASE falls to 0; treat a NULL gap as a new session (gap IS NULL OR gap > 30) — The first row in each partition has no previous row, so LAG is NULL and the comparison is UNKNOWN. Handling NULL explicitly makes the first click start session 1, the three-valued-logic lesson again.
Check yourself
- How does a window function differ from GROUP BY?
- What do PARTITION BY, ORDER BY and the frame each control?
- How do ROW_NUMBER, RANK and DENSE_RANK treat ties?
- Why can't you filter on a window function in WHERE, and what do you do instead?
- Explain the gaps-and-islands trick.
- Why can
ROWS BETWEEN 6 PRECEDING AND CURRENT ROWbe wrong for a "7-day" metric?
Answers
- It returns a value for every row, computed over related rows, instead of collapsing each group to one row.
- PARTITION BY: which rows are related; ORDER BY: their order within the partition; frame: which of those rows feed the calculation for the current row.
- ROW_NUMBER: unique numbers, ties broken arbitrarily; RANK: equal ranks with gaps after; DENSE_RANK: equal ranks without gaps.
- Window functions are computed after WHERE (in the SELECT step). Compute them in a subquery or CTE and filter in the outer query.
- Within a run of consecutive values, value minus row number is constant; grouping by it collects each run.
- It counts the last 7 rows, which spans more than 7 days whenever days have no rows. Frame by time (RANGE over a date) or fill the calendar first.
Exercise
From study(student, day, minutes), find for each student: the day with their highest minutes, their 7-day rolling total on every day (counting calendar days, not rows, using a correlated sum or a self-join on the date range), and the first day their cumulative minutes passed 100.
Solution
import sqlite3

db = sqlite3.connect(":memory:")
db.executescript("""
CREATE TABLE study (student TEXT, day TEXT, minutes INT);
INSERT INTO study VALUES ('asha','2026-03-01',30),('asha','2026-03-02',45),('asha','2026-03-03',20),('asha','2026-03-09',60),
 ('ben','2026-03-01',10),('ben','2026-03-02',50),('ben','2026-03-04',40),('ben','2026-03-05',15);
""")
best_day = """SELECT student, day, minutes FROM (
    SELECT *, ROW_NUMBER() OVER (PARTITION BY student ORDER BY minutes DESC, day) AS rn FROM study) WHERE rn = 1"""
rolling = """SELECT a.student, a.day, SUM(b.minutes) AS last_7_calendar_days
    FROM study a JOIN study b ON b.student = a.student AND b.day BETWEEN date(a.day, '-6 days') AND a.day
    GROUP BY a.student, a.day ORDER BY a.student, a.day"""
crossed = """SELECT student, MIN(day) FROM (
    SELECT student, day, SUM(minutes) OVER (PARTITION BY student ORDER BY day) AS cum FROM study) WHERE cum >= 100 GROUP BY student"""
print("best day:", db.execute(best_day).fetchall())
for r in db.execute(rolling):
    print(r)
print("passed 100 minutes:", db.execute(crossed).fetchall())
The rolling total uses a range join on calendar days, because a ROWS frame would count the last seven rows: Asha's 9 March total correctly excludes 1–2 March even though they are the immediately preceding rows. (Databases with RANGE BETWEEN INTERVAL '6 days' PRECEDING frames do this directly.) The cumulative sum plus MIN(day) gives the first crossing.
This unlocks:
- CTEs and recursive queries — structuring multi-step queries like these.
- SQL for ML — point-in-time features are window functions over time.