The incident. Three dashboards reported three different numbers for "monthly active students" (412k, 389k, 455k). One counted any event, one counted lesson starts, one counted logins, and one of them used local time. The fix wasn't a better query; it was one agreed definition, implemented once, in a table everyone reads.
You already know: the whole SQL track (basics, joins, aggregation, windows, CTEs, plans, SQL for ML).
1. Six patterns that solve most SQL interview questions
The question. What do interviewers actually ask, and which tools answer it?
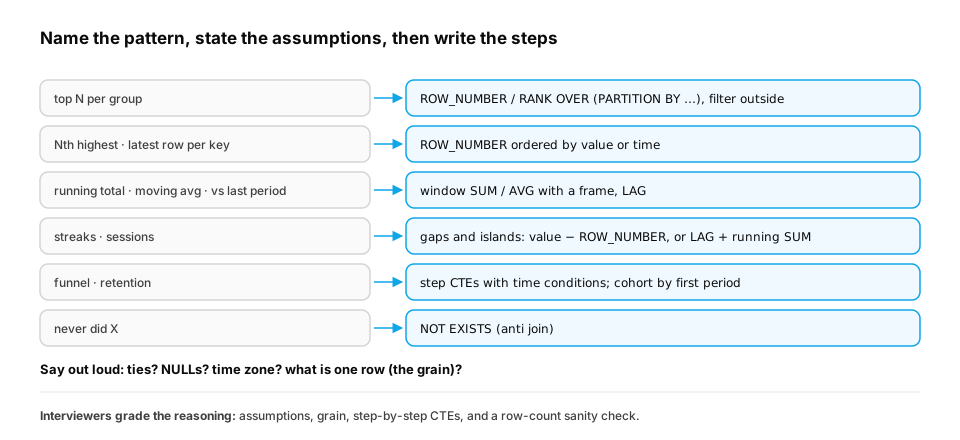
Start from nothing. Most questions reduce to a few patterns:
- Top-N per group: ROW_NUMBER/RANK over a partition, filter in an outer query.
- Nth highest / dedupe to latest row: ROW_NUMBER ordered by value or time.
- Running totals, moving averages, period-over-period: window SUM/AVG, LAG.
- Gaps and islands / streaks / sessions: value minus ROW_NUMBER, or LAG with a gap threshold.
- Funnels and retention: step CTEs with time conditions; cohort tables by first-activity period.
- Anti joins: "never did X" with NOT EXISTS.
State assumptions out loud (ties? NULLs? time zone?), start from the grain, build in CTE steps, and check row counts.
import sqlite3

db = sqlite3.connect(":memory:")
db.executescript("""
CREATE TABLE logins (student INT, ts TEXT);
INSERT INTO logins VALUES (1,'2026-03-01 08:00'),(1,'2026-03-01 08:20'),(1,'2026-03-01 11:00'),(1,'2026-03-01 11:10'),
 (2,'2026-03-01 09:00'),(2,'2026-03-01 09:50'),(2,'2026-03-01 09:55');
CREATE TABLE scores (student INT, score INT);
INSERT INTO scores VALUES (1,88),(2,95),(3,95),(4,70),(5,82);
""")
# sessions: a new session starts after 30+ minutes of inactivity (LAG + running sum of 'new session' flags)
sessions = """
WITH gaps AS (
  SELECT student, ts, CASE WHEN (julianday(ts) - julianday(LAG(ts) OVER (PARTITION BY student ORDER BY ts))) * 1440 > 30
                           OR LAG(ts) OVER (PARTITION BY student ORDER BY ts) IS NULL THEN 1 ELSE 0 END AS new_session
  FROM logins),
numbered AS (SELECT student, ts, SUM(new_session) OVER (PARTITION BY student ORDER BY ts) AS session_id FROM gaps)
SELECT student, session_id, MIN(ts), MAX(ts), COUNT(*) FROM numbered GROUP BY student, session_id
"""
for row in db.execute(sessions):
    print("session", row)
second = "SELECT DISTINCT score FROM scores ORDER BY score DESC LIMIT 1 OFFSET 1"
print("second-highest distinct score:", db.execute(second).fetchone()[0])
median = """SELECT AVG(score) FROM (SELECT score, ROW_NUMBER() OVER (ORDER BY score) AS rn, COUNT(*) OVER () AS n FROM scores)
            WHERE rn IN ((n + 1) / 2, (n + 2) / 2)"""
print("median score:", db.execute(median).fetchone()[0])
Sessionization combines patterns 3 and 4: LAG finds the gap, a running SUM of "new session" flags numbers the sessions. The median query handles odd and even counts with the same (n+1)/2, (n+2)/2 trick, a favourite follow-up question.
The output shows two sessions each for students 1 and 2 (student 2's 09:00 login stands alone, because the next one comes 50 minutes later). The second-highest distinct score is 88, since the two 95s count once, and the median of the five scores is 88.0.
In production. These six patterns are also most of what an analytics engineer writes day to day: dedupe-to-latest on change feeds, rolling features for models, sessionized product analytics, funnel and retention reporting, and "users who never did X" lists for lifecycle campaigns. Interviewers use them because they test the habits that keep production numbers right: thinking in grains, handling ties and NULLs explicitly, and building in checkable steps.
From production
Interview question: 'Return each user's second purchase.' A candidate writes SELECT user_id, MAX(created) FROM purchases WHERE created < (SELECT MAX(created) FROM purchases) GROUP BY user_id.
What's the robust approach?
Show the answer
A. ROW_NUMBER() OVER (PARTITION BY user_id ORDER BY created, purchase_id) in a CTE, then keep rn = 2: per user, deterministic on ties, and it returns the whole row — The global MAX subquery isn't per user and doesn't find the second purchase. Numbering rows per partition with a tiebreaker and filtering rn = 2 is the standard top-N/Nth-per-group pattern, and it keeps all the row's columns.
2. Cohort retention
The question. Of students who signed up in each month, what fraction were still active 1, 2, 3 months later?
Start from nothing. Assign each student a cohort (the month of first activity), compute months since that month for each later active month, and count distinct students per (cohort, month offset), divided by the cohort's size. The result is the classic retention triangle, the most important chart for a subscription product.
import random, sqlite3

random.seed(2)
db = sqlite3.connect(":memory:")
db.execute("CREATE TABLE activity (student INT, month INT)")          # month index: 0 = Jan 2026
for s in range(3000):
    start = random.choice([0, 1, 2, 3])
    keep = 0.75 if start >= 2 else 0.6                                 # a product improvement in March lifts retention
    m = start
    while m <= 5:
        db.execute("INSERT INTO activity VALUES (?, ?)", (s, m))
        if random.random() > keep:
            break
        m += 1
q = """
WITH cohort AS (SELECT student, MIN(month) AS c FROM activity GROUP BY student),
sizes AS (SELECT c, COUNT(*) AS n FROM cohort GROUP BY c)
SELECT co.c, a.month - co.c AS offset, ROUND(1.0 * COUNT(DISTINCT a.student) / s.n, 2)
FROM activity a JOIN cohort co USING (student) JOIN sizes s ON s.c = co.c
GROUP BY co.c, offset ORDER BY co.c, offset
"""
table = {}
for c, off, rate in db.execute(q):
    table.setdefault(c, {})[off] = rate
names = ["Jan", "Feb", "Mar", "Apr"]
print("cohort  " + "  ".join(f"m+{i}" for i in range(4)))
for c in sorted(table):
    print(f"{names[c]:<7} " + "  ".join(f"{table[c].get(i, ''):<4}" if i in table[c] else "    " for i in range(4)))
Reading down a column compares cohorts at the same age: the March and April cohorts retain better at m+1 than January and February, the signature of a product improvement in March. Retention by cohort separates "the product got better" from "we acquired more users", which overall active counts mix together.
The printed triangle: January keeps 0.62, 0.39 and 0.24 after one, two and three months; February 0.58, 0.33 and 0.21; March 0.76, 0.54 and 0.41; April 0.75 and 0.55 (its m+3 month hasn't happened yet).
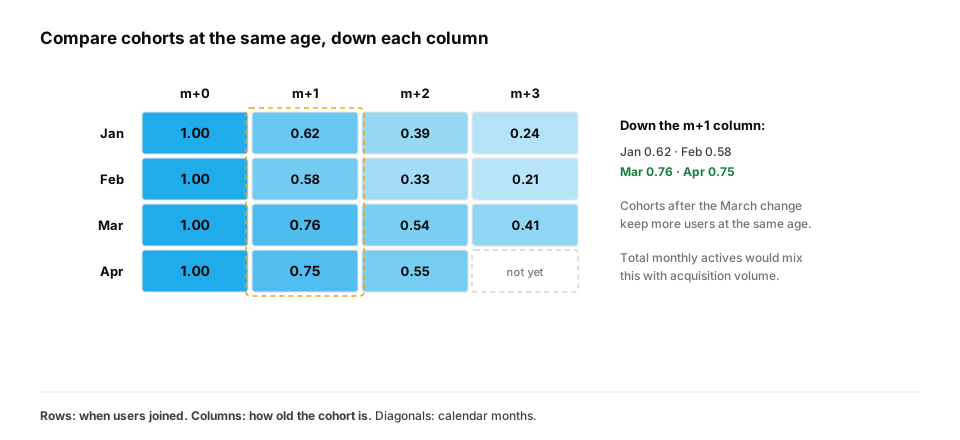
In production. Retention triangles are read three ways: down a column (are newer cohorts better at the same age?), along a row (how does one cohort decay?), and along a diagonal (what happened in a given calendar month across all cohorts, such as an outage or a seasonal dip?). The definition of "active" matters as much as the SQL. Agree on it once, and implement it in one place (section 3), or two teams' retention curves won't match.
Quick check
Monthly active students rose 20% after a marketing campaign. How do you tell whether the product itself improved?
Show the answer
D. Build cohort retention: compare retention curves of cohorts acquired before and after the change at the same months-since-signup — MAU mixes acquisition and retention. Cohort curves hold acquisition fixed and show whether each group of users sticks around longer.
3. Capstone: a small analytics warehouse
The question. How should Atlas's analytics be structured so every dashboard agrees?
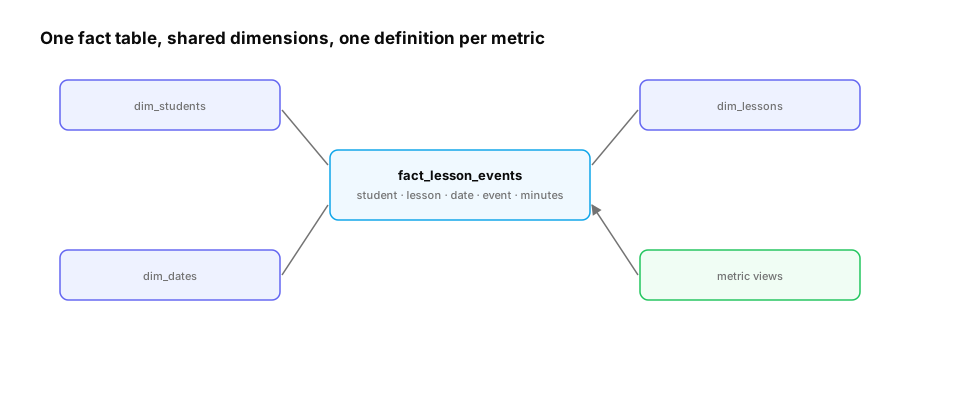
Start from nothing. A star schema: fact tables record events at a declared grain (one row per lesson event), with foreign keys to dimension tables describing who, what and when (students, lessons, dates). Metric definitions live in one place (a view or a modelled table, e.g., in dbt), and a daily snapshot table materializes the expensive metrics. Load raw data unchanged, transform it in versioned SQL, and test the results (row counts, uniqueness, non-null keys, accepted values), the same discipline as the data pipelines of D16.
import random, sqlite3

random.seed(5)
db = sqlite3.connect(":memory:")
db.executescript("""
CREATE TABLE dim_students (student_key INTEGER PRIMARY KEY, country TEXT, signup_date TEXT);
CREATE TABLE dim_lessons (lesson_key INTEGER PRIMARY KEY, course TEXT, difficulty TEXT);
CREATE TABLE fact_lesson_events (student_key INT REFERENCES dim_students, lesson_key INT REFERENCES dim_lessons,
                                 event_date TEXT, event TEXT CHECK (event IN ('start', 'complete')), minutes INT);
""")
db.executemany("INSERT INTO dim_students VALUES (?, ?, ?)",
               [(i, random.choice(["IN", "US", "GB", "NG"]), f"2026-0{random.randint(1, 3)}-1{random.randint(0, 9)}") for i in range(500)])
db.executemany("INSERT INTO dim_lessons VALUES (?, ?, ?)",
               [(i, random.choice(["ML101", "SQL1", "LLM2"]), random.choice(["easy", "hard"])) for i in range(60)])
for _ in range(8000):
    s, l, day = random.randrange(500), random.randrange(60), f"2026-03-{random.randint(1, 31):02d}"
    db.execute("INSERT INTO fact_lesson_events VALUES (?, ?, ?, 'start', ?)", (s, l, day, random.randint(3, 40)))
    if random.random() < 0.55:
        db.execute("INSERT INTO fact_lesson_events VALUES (?, ?, ?, 'complete', 0)", (s, l, day))
db.executescript("""
CREATE VIEW metric_active_students AS          -- the one definition: a student with >= 1 lesson start that day (UTC)
SELECT event_date, COUNT(DISTINCT student_key) AS active_students FROM fact_lesson_events WHERE event = 'start' GROUP BY event_date;
CREATE VIEW metric_completion_by_course AS
SELECT l.course, l.difficulty,
       ROUND(1.0 * SUM(f.event = 'complete') / SUM(f.event = 'start'), 3) AS completion_rate,
       SUM(f.minutes) AS minutes_studied
FROM fact_lesson_events f JOIN dim_lessons l USING (lesson_key) GROUP BY l.course, l.difficulty;
""")
tests = {
    "no orphan student keys": "SELECT COUNT(*) FROM fact_lesson_events f LEFT JOIN dim_students s USING (student_key) WHERE s.student_key IS NULL",
    "no NULL dates": "SELECT COUNT(*) FROM fact_lesson_events WHERE event_date IS NULL",
    "completions never exceed starts per course": "SELECT COUNT(*) FROM metric_completion_by_course WHERE completion_rate > 1",
}
for name, q in tests.items():
    print(f"test {name:<45} {'PASS' if db.execute(q).fetchone()[0] == 0 else 'FAIL'}")
print("March avg daily active:", round(db.execute("SELECT AVG(active_students) FROM metric_active_students").fetchone()[0], 1))
for row in db.execute("SELECT * FROM metric_completion_by_course ORDER BY course, difficulty"):
    print(row)
Dashboards now query metric_active_students instead of each writing their own definition, so the three conflicting numbers become one, and the data tests run on every load so a broken pipeline fails loudly instead of quietly changing the metric.
All three tests pass. The single definition gives a March average of 202.1 daily active students, and the completion view reports between 0.531 and 0.571 per course and difficulty in this random sample.
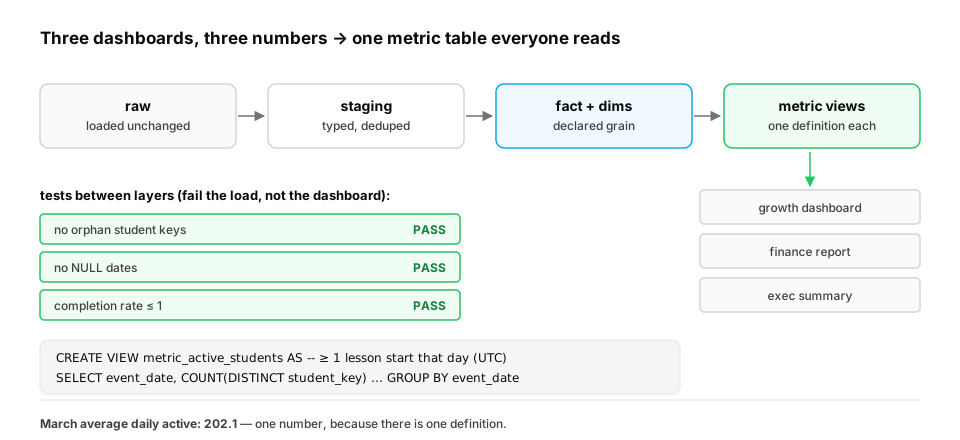
In production. This layering (raw, staging, modelled facts and dimensions, metrics) is the standard shape of a modern analytics stack. dbt implements each layer as versioned SQL models with tests, and "semantic layer" tools go one step further by defining metrics such as "active students" once and generating the SQL for every dashboard. For AI teams, the same warehouse also produces training sets and evaluation slices, so a single trusted definition of "active", "completed" or "churned" benefits both the dashboards and the models.
From production
Growth reports 455k monthly active students, finance 412k and product 389k. Each team wrote its own SQL against the raw events table.
What's the durable fix?
Show the answer
C. Agree on one definition (which event, which time zone, which window), implement it once as a modelled metric table or view with tests, and point every dashboard at it — The disagreement is about definitions, not arithmetic. One tested implementation that everyone reads removes the conflict and makes future changes deliberate and visible.
Check yourself
- Name the six common SQL interview patterns and the tool for each.
- How do you sessionize events with a 30-minute inactivity rule?
- How is a cohort retention table built, and why is it better than MAU for judging the product?
- What are fact and dimension tables, and why define metrics once?
- What three ways can you read a cohort retention triangle, and what does each show?
- Why should data tests run between pipeline layers rather than only on the final dashboard?
Answers
- Top-N per group (ROW_NUMBER), Nth/latest (ROW_NUMBER), running/period-over-period (window SUM, LAG), gaps and islands (value − ROW_NUMBER), funnels/retention (step CTEs, cohorts), anti joins (NOT EXISTS).
- Use LAG to compute the gap to the previous event, flag gaps over 30 minutes as new sessions, and take a running SUM of the flags as the session ID.
- Assign each user a cohort by first-activity period, count distinct active users per cohort and offset, divide by cohort size. It holds acquisition fixed, so changes in retention reflect the product.
- Facts record events at a declared grain; dimensions describe the entities they reference. One definition per metric means every dashboard agrees and changes happen in one place.
- Down a column (newer vs older cohorts at the same age), along a row (one cohort's decay over time), and along a diagonal (one calendar month's effect across all cohorts).
- A failure caught at the layer where it enters (orphan keys, NULL dates, duplicated grain) stops the load before a wrong number reaches anyone, and points straight at the broken step.
Exercise
Add a dim_dates table to the warehouse (date, week of year, weekday, is_weekend) generated with a recursive CTE for March 2026, then answer: (a) completion rate on weekends vs weekdays, (b) the top 2 courses by minutes studied per week, using the patterns from this lesson.
Solution
import random, sqlite3

random.seed(5)
db = sqlite3.connect(":memory:")
db.executescript("""
CREATE TABLE dim_lessons (lesson_key INTEGER PRIMARY KEY, course TEXT);
CREATE TABLE fact_lesson_events (student_key INT, lesson_key INT, event_date TEXT, event TEXT, minutes INT);
CREATE TABLE dim_dates AS
WITH RECURSIVE d(day) AS (SELECT '2026-03-01' UNION ALL SELECT date(day, '+1 day') FROM d WHERE day < '2026-03-31')
SELECT day, CAST(strftime('%W', day) AS INT) AS week, CAST(strftime('%w', day) AS INT) AS weekday,
       CAST(strftime('%w', day) AS INT) IN (0, 6) AS is_weekend FROM d;
""")
db.executemany("INSERT INTO dim_lessons VALUES (?, ?)", [(i, ["ML101", "SQL1", "LLM2"][i % 3]) for i in range(30)])
for _ in range(6000):
    s, l, day = random.randrange(400), random.randrange(30), f"2026-03-{random.randint(1, 31):02d}"
    db.execute("INSERT INTO fact_lesson_events VALUES (?, ?, ?, 'start', ?)", (s, l, day, random.randint(3, 40)))
    weekend = db.execute("SELECT is_weekend FROM dim_dates WHERE day = ?", (day,)).fetchone()[0]
    if random.random() < (0.65 if weekend else 0.5):
        db.execute("INSERT INTO fact_lesson_events VALUES (?, ?, ?, 'complete', 0)", (s, l, day))
q_a = """SELECT CASE d.is_weekend WHEN 1 THEN 'weekend' ELSE 'weekday' END,
         ROUND(1.0 * SUM(f.event = 'complete') / SUM(f.event = 'start'), 3)
         FROM fact_lesson_events f JOIN dim_dates d ON d.day = f.event_date GROUP BY d.is_weekend"""
q_b = """WITH weekly AS (SELECT d.week, l.course, SUM(f.minutes) AS minutes FROM fact_lesson_events f
            JOIN dim_dates d ON d.day = f.event_date JOIN dim_lessons l USING (lesson_key) GROUP BY d.week, l.course),
         ranked AS (SELECT *, ROW_NUMBER() OVER (PARTITION BY week ORDER BY minutes DESC) AS rn FROM weekly)
         SELECT week, course, minutes FROM ranked WHERE rn <= 2 ORDER BY week, rn"""
print(db.execute(q_a).fetchall())
for row in db.execute(q_b):
    print(row)
The date dimension turns calendar logic (weekends, week numbers) into a join instead of repeated date functions in every query, and the top-2-per-week question is pattern 1 on top of a weekly aggregate. The simulated data was built with a higher weekend completion rate, and the query recovers it.
This unlocks:
- Data ingestion and storage (D16) — lakehouses and columnar tables at scale.
- ML pipelines (D11) — the same warehouse feeding training sets and monitoring.