The incident. A nightly embedding job "succeeds" for 11 days, but the search index is quietly going stale. The cause: except Exception: pass around the upload call. The vector database had changed its auth, every upload raised an error, and the code swallowed every one. No alert, no log line, no failed run.
You already know: functions, classes and dataclasses (Classes, dataclasses and type hints); context managers (Decorators and context managers).
1. Exceptions: fail loudly, catch narrowly
The question. When should code catch an exception, and what should it do?
Start from nothing. An exception is Python's way to say "this can't continue normally". It travels up the call stack until some try/except catches it, or the program stops with a traceback. Good habits:
- Catch only what you can handle, and catch specific types (
KeyError,TimeoutError), never a bareexcept:. elseruns when no exception happened;finallyalways runs.- Define your own exception types so callers can tell "bad input" from "the provider is down".
- When converting errors, use
raise NewError(...) from errso the original cause stays in the traceback.
class ProviderError(Exception):
    """The upstream model provider failed; worth retrying later."""

class BadRequest(Exception):
    """The caller sent something invalid; retrying won't help."""

def parse_tokens(raw):
    try:
        value = int(raw)
    except ValueError as err:
        raise BadRequest(f"max_tokens must be an integer, got {raw!r}") from err
    if value <= 0:
        raise BadRequest("max_tokens must be positive")
    return value

for raw in ["256", "lots", "-5"]:
    try:
        tokens = parse_tokens(raw)
    except BadRequest as err:
        print("400:", err, "| cause:", repr(err.__cause__))
    else:
        print("ok:", tokens)
The output: ok: 256, then 400: max_tokens must be an integer, got 'lots' | cause: ValueError(...), then 400: max_tokens must be positive | cause: None. An API layer can map BadRequest to HTTP 400 and ProviderError to 503 with a retry.
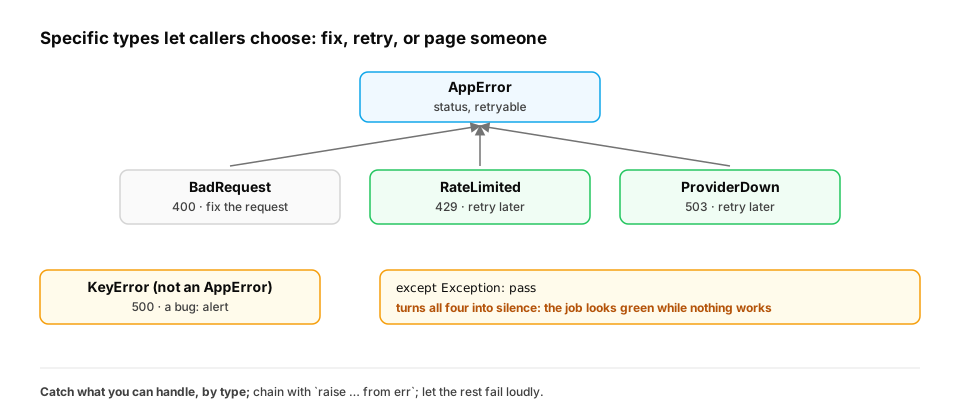
A real-world pattern: one place that turns exceptions into responses. Services usually define a small hierarchy with a common base, and put the decision "what do we tell the caller, and is it worth retrying?" on the exception types themselves. Anything that isn't one of your deliberate errors is, by definition, a bug:
class AppError(Exception):
    """Base class: everything our service raises on purpose."""
    status, retryable = 500, False

class BadRequest(AppError):
    status, retryable = 400, False

class RateLimited(AppError):
    status, retryable = 429, True

class ProviderDown(AppError):
    status, retryable = 503, True

def to_response(err):
    if isinstance(err, AppError):
        return err.status, ("retry later" if err.retryable else "fix the request"), str(err)
    return 500, "bug: page someone", type(err).__name__     # anything unexpected is a bug

for err in [BadRequest("max_tokens must be positive"), RateLimited("60 rpm exceeded"),
            ProviderDown("upstream 502"), KeyError("api_key")]:
    print(to_response(err))
Each deliberate error maps to its status and advice: (400, 'fix the request', …), (429, 'retry later', …), (503, 'retry later', …). The KeyError falls through to (500, 'bug: page someone', 'KeyError'). Note that the response carries only the exception's type there, not its message, so internal details (here, the name of a secret) don't leak to the caller.
In production. Web frameworks have a hook for exactly this, such as FastAPI's exception handlers and Flask's
errorhandler. LLM SDKs ship typed error hierarchies of their own. The Anthropic Python SDK, for example, raises distinct classes for rate limits, connection failures and other API status errors, so your retry logic can catchRateLimitErrorwithout also retrying a malformed request. Retry only what's marked retryable, and alert on everything that reaches the "bug" branch.
From production
A code review finds try: upload(batch) except Exception: pass in a nightly job.
What's the best replacement?
Show the answer
A. Catch the specific transient errors you expect, retry them with backoff, and let anything else fail the run loudly (with a log and an alert) — Swallowing every error turns real failures into silent data loss. Handle the errors you understand; everything else should fail the run, so monitoring notices.
2. Logging instead of print
The question. Why do production systems use logging instead of print?
Start from nothing. The logging module adds levels (DEBUG, INFO, WARNING, ERROR), timestamps and logger names, and lets each environment decide what to show and where to send it, without code changes. logger.exception(...) inside an except records the full traceback. Pass values as arguments (or structured fields), so log systems can search them.
import logging, sys

logging.basicConfig(
    stream=sys.stdout, level=logging.INFO,
    format="%(levelname)s %(name)s: %(message)s",
)
log = logging.getLogger("embedder")

log.debug("not shown: level is INFO")
log.info("batch %d uploaded (%d vectors)", 7, 512)
try:
    {}["api_key"]
except KeyError:
    log.exception("upload failed for batch %d", 8)
This prints INFO embedder: batch 7 uploaded (512 vectors), then ERROR embedder: upload failed for batch 8 followed by the full traceback. In production you'd usually emit JSON lines with fields like request_id and user_id, so one request can be traced across services.
Watch out. Never log secrets, API keys or full user prompts containing personal data. Logs are copied to many systems and kept for a long time.
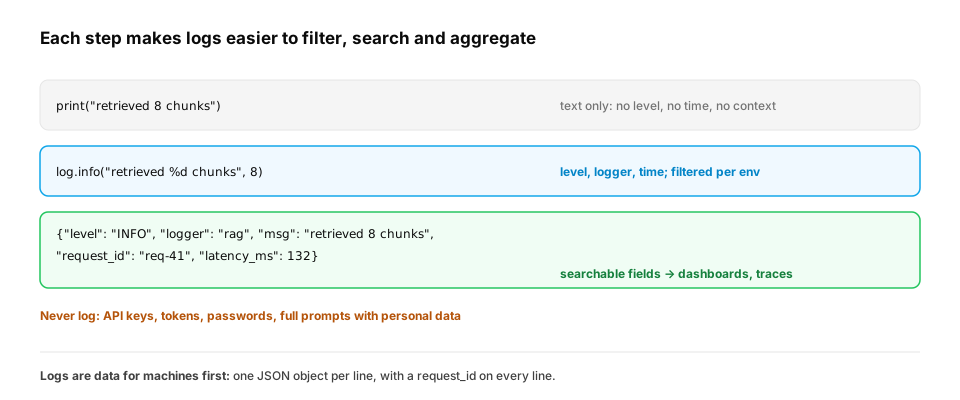
What production logs look like: one JSON object per line. Log platforms such as Datadog, Elasticsearch, Loki and CloudWatch can index fields, but only if you emit fields rather than prose. A small formatter turns every log call into JSON and carries context like the request ID:
import json, logging, sys

class JsonFormatter(logging.Formatter):
    def format(self, record):
        entry = {"level": record.levelname, "logger": record.name, "msg": record.getMessage()}
        entry.update(getattr(record, "fields", {}))          # structured context passed via extra=
        return json.dumps(entry)

handler = logging.StreamHandler(sys.stdout)
handler.setFormatter(JsonFormatter())
log = logging.getLogger("rag")
log.addHandler(handler)
log.setLevel(logging.INFO)
log.propagate = False

log.info("retrieved %d chunks", 8, extra={"fields": {"request_id": "req-41", "latency_ms": 132}})
log.warning("context truncated", extra={"fields": {"request_id": "req-41", "dropped_tokens": 950}})
Each call prints one line of JSON, for example {"level": "INFO", "logger": "rag", "msg": "retrieved 8 chunks", "request_id": "req-41", "latency_ms": 132}. Now "show every request where dropped_tokens > 500" or "p95 of latency_ms by hour" is a query, not a grep. Both lines share request_id, so you can follow one user's request through retrieval, generation and any retries.
In production. Libraries such as
structlogandpython-json-loggerdo this for you, and OpenTelemetry adds trace and span IDs automatically, so logs line up with distributed traces. For LLM features specifically, teams log prompt metadata (model, token counts, latency, cache hits, which retrieved document IDs were used) rather than the full prompt text, and keep the full text, if at all, in an access-controlled store with a retention limit.
From production
During an incident you need 'all requests from the last hour where the model call took over 5 seconds, grouped by model'. The service logs lines like print(f'call done {model} took {secs}s').
What would have made this a one-minute query?
Show the answer
C. Structured logs: one JSON object per line with fields like model, latency_ms and request_id, sent to a log platform that indexes them — Free-text logs need fragile regexes to parse. Structured fields can be filtered, grouped and graphed directly, and a request_id lets you follow one request across services.
3. Tests with pytest
The question. How do you know a change didn't break something that used to work?
Start from nothing. A test is code that runs your code and checks the result with assert. pytest finds files named test_*.py, runs every test_* function, and reports failures with clear diffs. Three features cover most needs: plain assert, pytest.raises for expected errors, and parametrize for many cases in one test.
# test_tokens.py — run with: pytest -q
import pytest
from myapp.tokens import parse_tokens, BadRequest
from myapp.client import call_with_retry

@pytest.mark.parametrize("raw, expected", [("1", 1), ("256", 256), (" 42 ", 42)])
def test_parses_valid_values(raw, expected):
    assert parse_tokens(raw) == expected

@pytest.mark.parametrize("raw", ["lots", "", "-5", "0"])
def test_rejects_invalid_values(raw):
    with pytest.raises(BadRequest):
        parse_tokens(raw)

def test_retry_gives_up(monkeypatch):
    calls = []
    def always_fails(prompt):
        calls.append(prompt)
        raise ConnectionError("down")
    monkeypatch.setattr("myapp.client.send", always_fails)   # replace the network call
    with pytest.raises(ConnectionError):
        call_with_retry("hi", attempts=3)
    assert len(calls) == 3
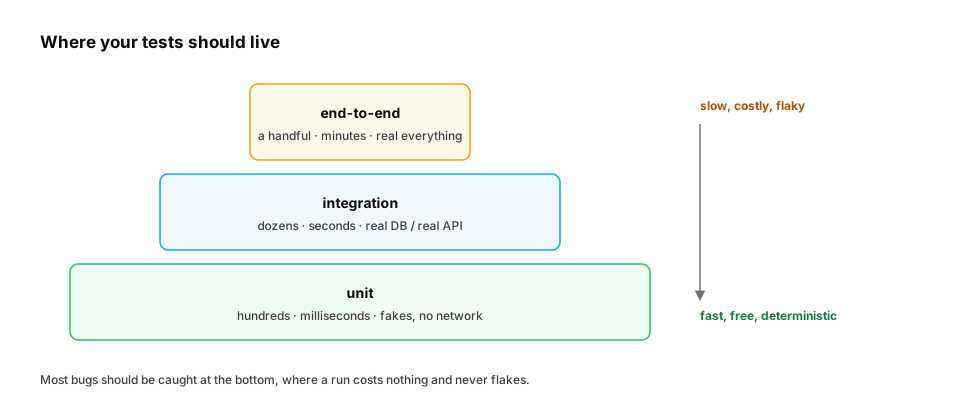
The last test fakes the network with monkeypatch, so it runs in milliseconds, costs nothing and never flakes. Test the behaviour you promised (it retries 3 times, then raises), not the implementation details.
From production
A team's test suite calls the real LLM API. It takes 14 minutes, costs money on every run and fails randomly about 1 run in 10.
What's the most effective change?
Show the answer
D. Put the provider behind an interface and use fakes in unit tests; keep a small, separate set of real-API integration tests — Unit tests should be fast, free and deterministic, which means no network. A few integration tests still check the real provider, but they're separate and run less often. Retrying flaky tests hides real bugs.
4. Environments and packaging with uv
The question. How do you make "works on my machine" work on every machine?
Start from nothing. Each project needs its own virtual environment (an isolated set of installed packages) and a lockfile that pins every dependency to an exact version. The modern tool for both is uv: it creates the environment, resolves dependencies, writes uv.lock, and is much faster than pip. Project metadata lives in pyproject.toml.
uv init atlas-tools          # creates pyproject.toml and a package skeleton
cd atlas-tools
uv add httpx pydantic        # adds dependencies and updates uv.lock
uv add --dev pytest mypy     # tools only needed for development
uv run pytest -q             # runs inside the project's environment
uv sync --frozen             # in CI or Docker: install exactly what the lockfile says
Commit both pyproject.toml and uv.lock. In CI and Docker, install with --frozen so a new release of some library can't silently change production. A typical layout puts code in src/atlas_tools/ and tests in tests/.
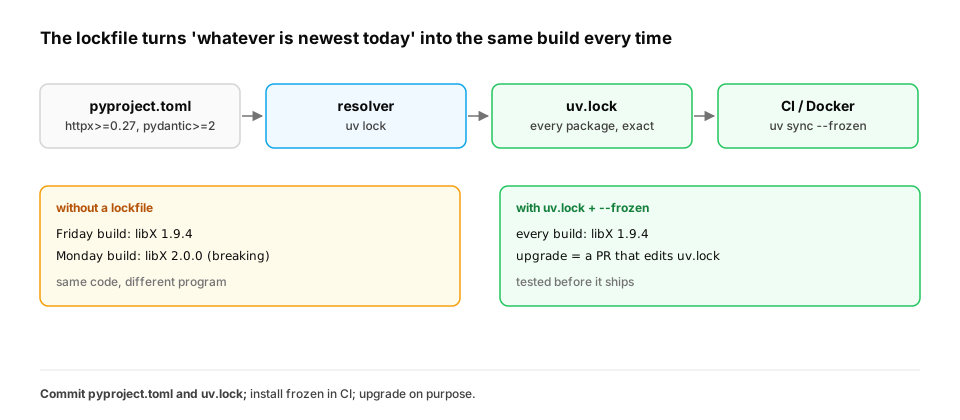
Why AI projects feel this more than most. ML stacks have deep, fast-moving dependency trees. PyTorch builds are tied to CUDA versions, tokenizer libraries ship compiled wheels, and LLM SDKs release often. Three habits keep builds reproducible:
- Pin the Python version too (
requires-pythoninpyproject.toml, and a fixed base image in Docker). A minor Python upgrade can change library wheels and behaviour. - Separate runtime and development dependencies (
uv add --dev), so production images don't ship test tools and linters. - Upgrade on a schedule, in their own PRs, with the test suite as the gate. Bots such as Dependabot and Renovate open these PRs automatically and can update lockfiles.
In production. A Docker build that copies
pyproject.tomlanduv.lockfirst, installs dependencies, and only then copies the source code lets Docker cache the slow dependency layer between builds. Code changes no longer reinstall PyTorch. The same lockfile is what makes "the eval ran on the same environment as production" a true statement. That matters when a metric moves and you need to know whether the model changed or a library did.
From production
Production breaks on Monday with no code changes. Investigation shows pip install -r requirements.txt pulled a new major version of a dependency over the weekend.
What prevents this?
Show the answer
B. A lockfile with exact versions (e.g. uv.lock), installed with --frozen in CI and Docker, and dependency upgrades done deliberately in their own PRs — Unpinned requirements resolve to whatever is newest at install time, so the same code can build differently on different days. A lockfile makes builds reproducible; upgrades happen on purpose and get tested.
Check yourself
- Why is
except Exception: passdangerous? - What does
raise X from errpreserve? - Name two advantages of
loggingoverprint. - What problem does a lockfile solve?
- Why should an error response for an unexpected exception include its type but not its message?
- What makes a JSON log line more useful than a printed sentence during an incident?
Answers
- It silently hides every failure, including ones you never anticipated, so broken systems look healthy.
- The original exception as
__cause__, so the traceback shows both the new error and what caused it. - Levels you can filter per environment, timestamps and logger names, tracebacks via
logger.exception, and configurable destinations. - Builds that change over time: it pins every package (including indirect dependencies) to exact versions, so every install is identical.
- Unexpected errors can carry internal details (file paths, keys, SQL, other users' data) in their message. Log the full error internally, and return a generic message to the caller.
- Its fields can be filtered, grouped and graphed directly (latency by model, errors by request_id), instead of parsed with fragile text searches.
Exercise
Write load_config(text) that parses a JSON config string and returns a dict with model (str, required) and timeout (number, default 30, must be 1–120). Raise a custom ConfigError with a helpful message for invalid JSON, a missing model or a bad timeout, chaining the original error where there is one. Then write plain-assert tests for four cases.
Solution
import json

class ConfigError(Exception):
    pass

def load_config(text):
    try:
        data = json.loads(text)
    except json.JSONDecodeError as err:
        raise ConfigError(f"config is not valid JSON (line {err.lineno})") from err
    if not isinstance(data.get("model"), str):
        raise ConfigError("'model' is required and must be a string")
    timeout = data.get("timeout", 30)
    if not isinstance(timeout, (int, float)) or not 1 <= timeout <= 120:
        raise ConfigError(f"'timeout' must be between 1 and 120, got {timeout!r}")
    return {"model": data["model"], "timeout": timeout}

def expect_error(text, fragment):
    try:
        load_config(text)
    except ConfigError as err:
        assert fragment in str(err), err
        return err
    raise AssertionError("expected ConfigError")

assert load_config('{"model": "small"}') == {"model": "small", "timeout": 30}
err = expect_error('{"model": ', "not valid JSON")
assert isinstance(err.__cause__, json.JSONDecodeError)
expect_error('{"timeout": 10}', "'model' is required")
expect_error('{"model": "small", "timeout": 999}', "between 1 and 120")
print("all 4 tests passed")
Each failure message says what's wrong and what's expected, which is what an on-call engineer needs at 2 a.m. With pytest, expect_error becomes with pytest.raises(ConfigError, match=...).
This unlocks:
- NumPy and pandas — fast numerical code, now with tests to prove it's still correct.
- Profiling — finding the slow line before optimising anything.
- Interview prep and capstone — a tested, packaged project you can show.