The incident. A retrieval team computes cosine similarity between a query and 1 million document embeddings with two nested Python loops. Each search takes 9 seconds, so the feature is "too slow to ship". A new hire rewrites it as one matrix–vector product. Search takes 30 milliseconds, and the feature ships that week.
You already know: lists store pointers to separate objects (Lists and tuples); CPython runs bytecode one instruction at a time (How Python really runs your code).
1. Why NumPy is fast
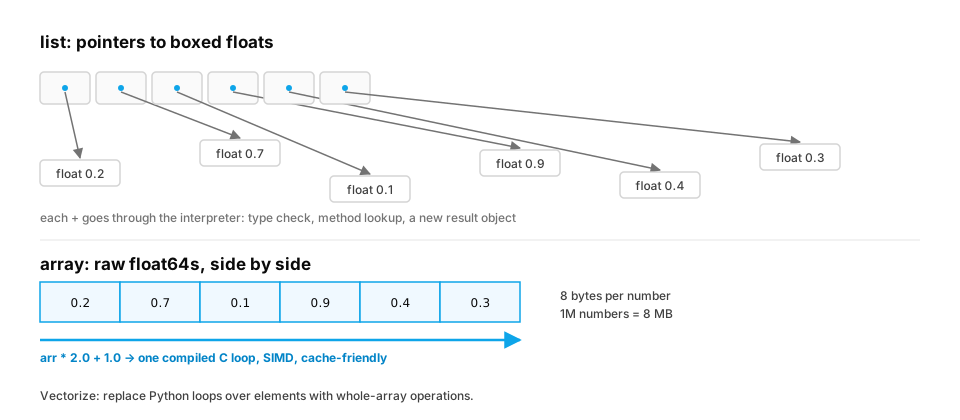
A Python list of floats is an array of pointers to separate float objects scattered in memory, and each + in a loop goes through the interpreter: type checks, method lookup, a new result object. A NumPy array is one block of raw numbers of one type (float32, int64…), side by side. An operation like a * b runs a tight, compiled C loop over that block, using CPU vector instructions (SIMD) and the cache efficiently. Writing whole-array operations instead of loops is called vectorization.
import time
import numpy as np

n = 1_000_000
xs = [float(i) for i in range(n)]
arr = np.arange(n, dtype=np.float64)

start = time.perf_counter()
loop_result = [x * 2.0 + 1.0 for x in xs]
t_loop = time.perf_counter() - start

start = time.perf_counter()
vec_result = arr * 2.0 + 1.0
t_vec = time.perf_counter() - start

print(f"python loop: {t_loop * 1000:.0f} ms, numpy: {t_vec * 1000:.1f} ms")
print("same answer:", np.allclose(loop_result, vec_result))
print(arr.dtype, arr.nbytes // 1_000_000, "MB for", arr.size, "numbers")
On an Apple M-series laptop (Python 3.9, NumPy 1.26) the loop takes about 32 ms and NumPy about 0.35 ms: roughly 90× faster. The array is exactly 8 MB (8 bytes per float64); the list needs about 32 MB, because every element is a pointer plus a 24-byte float object.
In production. Every library you'll use for ML data (pandas, scikit-learn, PyTorch, Hugging Face datasets) passes NumPy-style arrays underneath. The first question in a slow data pipeline is almost always "is there a Python loop touching every element?" Rewriting that loop as array operations is usually a bigger win than any amount of tuning elsewhere.
From production
A colleague says NumPy is fast 'because it uses all the CPU cores'. Their arr * 2.0 + 1.0 on 10 million floats runs ~90× faster than a list comprehension, and only one core is busy.
What actually explains most of the speed-up?
Show the answer
A. The array is one typed contiguous buffer, and the operation is a compiled loop (with SIMD) that skips per-element interpreter work and object creation — Element-wise NumPy operations mostly run on one core. The gain comes from removing per-element interpreter dispatch, boxing and pointer chasing, and from cache-friendly SIMD loops. Matrix multiplication is the case that also uses threads, through BLAS.
2. What an array really is
Speed is half the story. The other half is that NumPy can reshape, transpose, slice and broadcast without copying a single number, and that trick explains most of its behaviour, including its surprises.
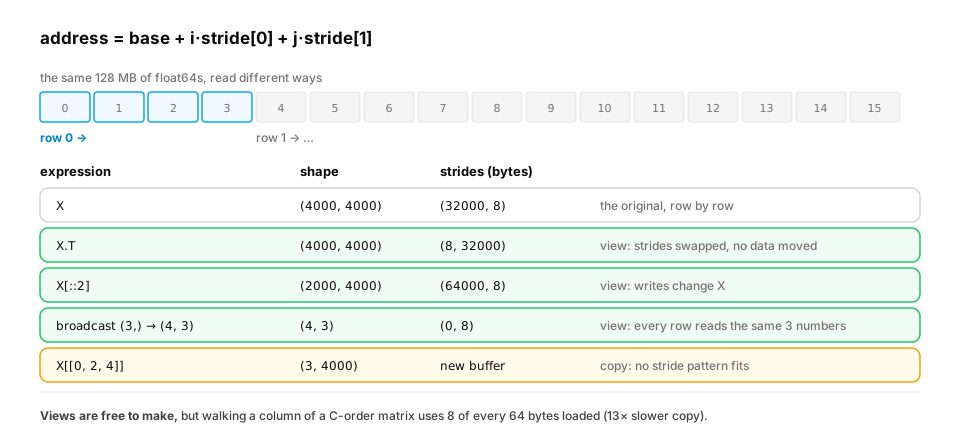
An array is four things: a pointer to a block of bytes, a dtype (how to read each element), a shape, and strides: how many bytes to step to move one position along each axis. The element at index (i, j, …) lives at
address = base + i * stride[0] + j * stride[1] + …
For a (4000, 4000) float64 matrix stored row by row (C order), stepping one column moves 8 bytes and stepping one row moves 4000 × 8 = 32,000 bytes, so the strides are (32000, 8). Everything else follows from that formula:
- Transpose swaps the strides to
(8, 32000). No data moves; it's a new view of the same bytes. - Slicing
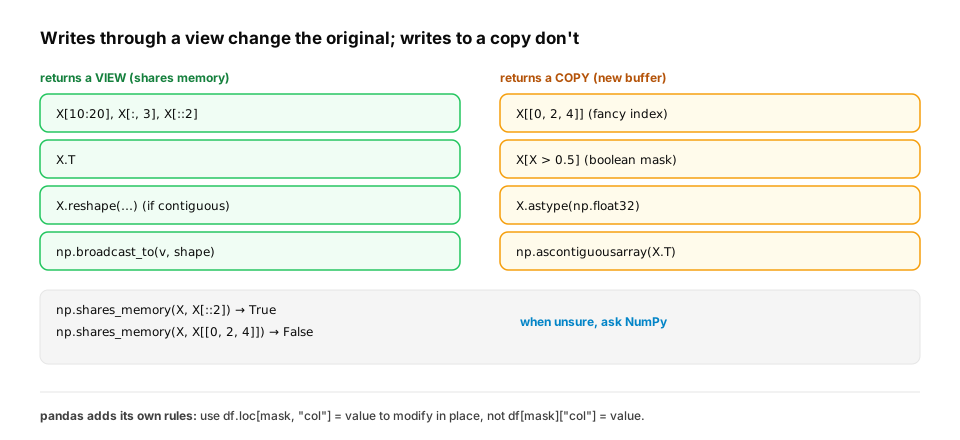
X[::2]doubles the row stride. Also a view: writing to it changesX. - Broadcasting sets a stride to 0. A
(3,)vector broadcast to(4, 3)has strides(0, 8): every "row" reads the same 3 numbers. That is how a vector is "stretched" over a million rows without being copied. - Fancy indexing
X[[0, 2, 4]]can't be described by strides, so it copies.
import numpy as np

X = np.random.default_rng(0).random((4000, 4000))
print(X.strides, X.T.strides)                               # (32000, 8) (8, 32000)
print(np.broadcast_to(np.ones(3), (4, 3)).strides)          # (0, 8)
print(np.shares_memory(X, X[::2]), np.shares_memory(X, X[[0, 2, 4]]))   # True False
Views are free, but strided access is not. The CPU loads memory in 64-byte cache lines, so walking along a row uses every byte it loaded, while walking down a column of a C-order matrix uses 8 bytes out of each 64 and throws the rest away. In my measurements, copying X took 2.5 ms; copying X.T into C order, the same 128 MB with column-wise reads, took 33.5 ms: 13× slower for the same bytes.
In production. Views are why a training loop can slice a batch out of a big array for free, and also why a "harmless" in-place edit on a slice can corrupt the source data. PyTorch inherits both:
tensor.view()andtensor.Tshare storage, and some kernels need.contiguous()first, which makes the copy explicit. When a profile shows time in an unexpected copy, a non-contiguous layout is a common reason.
From production
A preprocessing function receives a batch b = X[1000:2000] and normalises it in place with b -= b.mean(axis=0). Later, the original training matrix X has strange values in rows 1000–1999.
Why?
Show the answer
C. Basic slicing returns a view that shares X's memory, so the in-place subtraction wrote into X itself — X[1000:2000] is a view (same buffer, different offset). In-place operators (-=) write through the view into X. Use b = X[1000:2000].copy() or a non-in-place expression (b = b - b.mean(axis=0)) when the original must stay untouched.
3. Broadcasting in practice
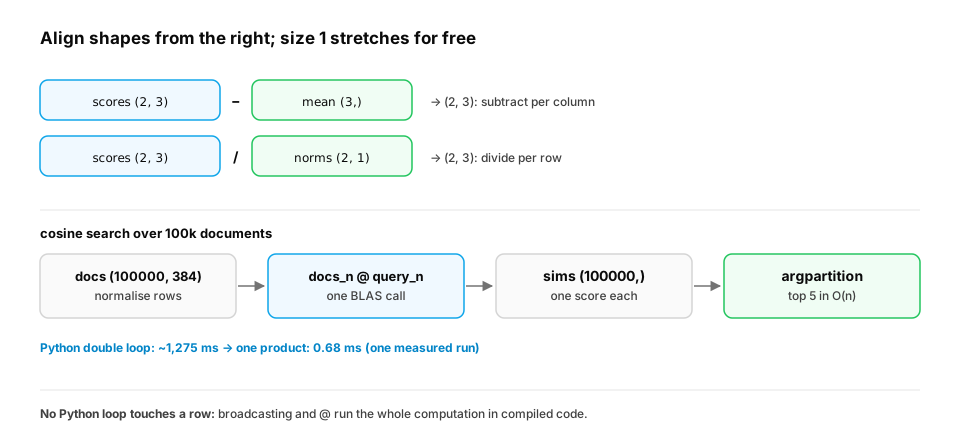
Broadcasting compares shapes from the right: two dimensions are compatible if they are equal or one of them is 1 (a missing dimension counts as 1). The size-1 dimension gets stride 0.
import numpy as np

scores = np.array([[0.2, 0.9, 0.4],
                   [0.7, 0.1, 0.8]])             # 2 queries x 3 documents
print(scores.shape, scores.max(axis=1), scores.argmax(axis=1))

mean = scores.mean(axis=0)                       # shape (3,): mean per document
centered = scores - mean                         # (2, 3) - (3,) broadcasts across rows
print(centered.round(2))

row_norms = np.linalg.norm(scores, axis=1, keepdims=True)   # shape (2, 1)
print((scores / row_norms).round(2))             # (2, 3) / (2, 1) broadcasts across columns

mask = scores > 0.5                              # boolean array, same shape
print(scores[mask], int(mask.sum()))
axis=1 means "along each row" (collapse the columns), axis=0 "down each column". Boolean masks like scores > 0.5 select elements without an if. keepdims=True keeps a (2, 1) shape so the division broadcasts per row.
Now the incident's fix: cosine similarity between one query and many documents is a normalisation plus one matrix–vector product.
import numpy as np

rng = np.random.default_rng(0)
docs = rng.normal(size=(100_000, 384)).astype(np.float32)   # 100k embeddings, 384 dims
query = rng.normal(size=384).astype(np.float32)

docs_n = docs / np.linalg.norm(docs, axis=1, keepdims=True)
query_n = query / np.linalg.norm(query)
sims = docs_n @ query_n                          # (100000, 384) @ (384,) -> (100000,)

top5 = np.argpartition(-sims, 5)[:5]             # the 5 best, without a full sort
top5 = top5[np.argsort(-sims[top5])]             # then order just those 5
print(sims.shape, top5.tolist())
print([round(float(s), 3) for s in sims[top5]])
@ is matrix multiplication, and NumPy hands it to a BLAS library (Accelerate on macOS, OpenBLAS or MKL elsewhere), which is hand-tuned and may use several cores. argpartition finds the top k in O(n) instead of sorting all 100,000 scores.
From production
A feature pipeline normalises each column of a (5_000_000, 40) float matrix with a Python loop over rows: for i in range(len(X)): X[i] = (X[i] - mu) / sigma. It takes 25 minutes.
What's the vectorized version?
Show the answer
A. X = (X - mu) / sigma with mu and sigma of shape (40,): broadcasting applies it to every row in compiled code — mu and sigma broadcast across all 5 million rows in one C-level operation, typically under a second. Threads wouldn't help: the per-row Python overhead is the problem, not the arithmetic.
4. The experiment: how much does each choice cost?
One run on an Apple M-series laptop, Python 3.9.6, NumPy 1.26.4, pandas 2.3.3, best of several runs. Your numbers will differ; the ratios are what matter. The script is in the Atlas repository.
| task | slow way | fast way | ratio |
|---|---|---|---|
x * 2 + 1 on 1M floats |
list comprehension: 31.5 ms | NumPy: 0.35 ms | 90× |
| dot product of two 1M vectors | sum(x*y for …): 32.6 ms |
a @ b: 0.43 ms |
76× |
same, with np.vectorize |
99.4 ms (slower than the plain loop) | ||
| cosine scores, 100k × 384 | Python loop: about 1,275 ms | docs_n @ query_n: 0.68 ms |
~1,900× |
| top 5 of 100k scores | full argsort: 5.7 ms |
argpartition: 1.1 ms |
5× |
| copy a 4000×4000 matrix | column-wise (X.T): 33.5 ms |
row-wise: 2.5 ms | 13× |
| a cost column on 1M rows (pandas) | df.apply(f, axis=1): about 2,480 ms |
df["tokens"] / 1000 * price: 0.65 ms |
~3,800× |
Three things to notice. np.vectorize was the slowest of all: despite the name, it calls your Python function once per element. The pandas apply(axis=1) row loop is the worst offender in real code, because it builds a Series object for every row. And the cosine search, the incident's exact workload, gains three orders of magnitude.
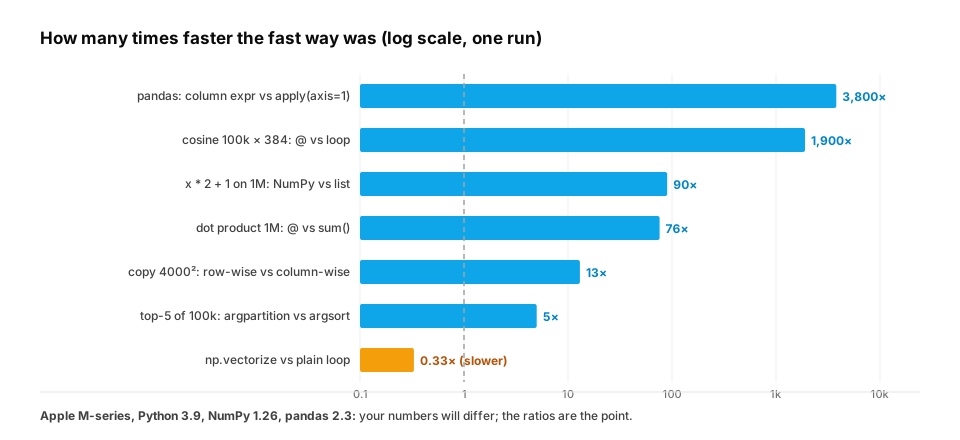
In production. Run this kind of side-by-side table on your own pipeline before arguing about optimisations. It's how teams decide where effort pays off. A 5× win on top-k matters little if the 3,800× row loop is still there. Profiling (the next lesson) tells you which line to start with.
From production
A teammate 'vectorizes' a scoring function with score = np.vectorize(py_score) and is surprised the job got slower.
What's the explanation and the real fix?
Show the answer
D. np.vectorize still calls the Python function once per element (it's a convenience wrapper); rewrite py_score as array expressions (arithmetic, np.where, masks) so the loop runs in C — NumPy's documentation says vectorize is for convenience, not performance. Real vectorization means expressing the computation with whole-array operations. Here, np.vectorize measured 0.33× the speed of a plain loop.
5. Pandas: labelled tables
When columns have names and different types, you want a pandas DataFrame: named columns, each stored as a NumPy array of one type, plus row labels (the index). The rule from the table above applies with even more force: use column operations, never loop over rows. The core verbs are: select and filter, add computed columns, groupby + aggregate, and merge (a SQL-style join).
import pandas as pd

calls = pd.DataFrame({
    "user":    ["asha", "ravi", "asha", "meera", "ravi", "asha"],
    "model":   ["small", "large", "large", "small", "small", "small"],
    "tokens":  [1200, 5400, 3100, 800, 950, 400],
    "latency": [0.8, 3.1, 2.2, 0.5, 0.7, 0.3],
})
prices = pd.DataFrame({"model": ["small", "large"], "usd_per_1k": [0.0005, 0.003]})

df = calls.merge(prices, on="model", how="left")             # join on model
df["cost"] = df["tokens"] / 1000 * df["usd_per_1k"]          # a vectorized column

slow = df[df["latency"] > 1.0]                               # boolean filter
print(slow[["user", "model", "latency"]].to_string(index=False))

per_user = (df.groupby("user")
              .agg(calls=("tokens", "size"), tokens=("tokens", "sum"), cost=("cost", "sum"))
              .sort_values("cost", ascending=False))
print(per_user.round(4))
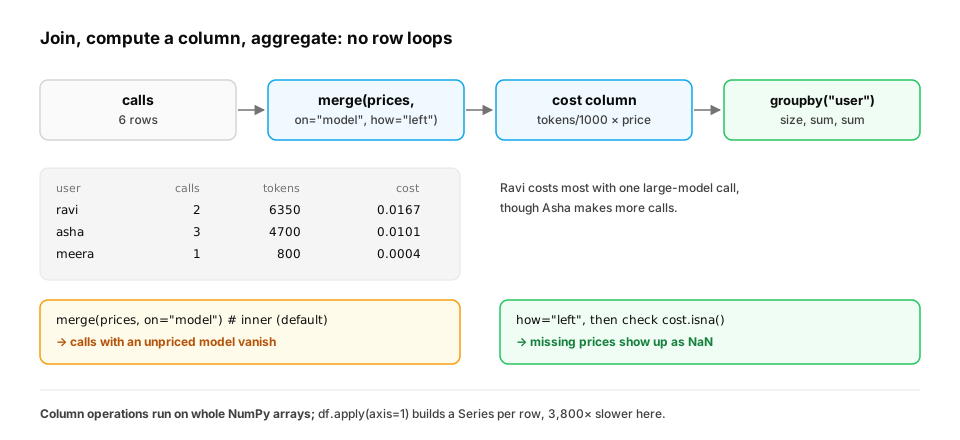
Ravi is the most expensive user (one 5,400-token call on the large model), even though Asha makes more calls. merge(..., how="left") keeps every call even if a model had no price, which would show up as a NaN (missing value) cost you should check for.
From production
After calls.merge(prices, on='model'), the analyst sees fewer rows than in calls, and total spend looks 8% too low.
What's the most likely cause?
Show the answer
C. The default inner join dropped calls whose model is missing from the prices table — merge defaults to an inner join: rows without a match on both sides disappear. Use how='left' and then check for NaN prices (or pass validate= and indicator=True) so missing data shows up instead of vanishing.
6. Memory, dtypes and precision
A 2 GB CSV can need 12 GB of RAM in pandas. By default, text columns become Python string objects (the object dtype, which stores pointers again) and numbers become 64-bit. Choosing dtypes shrinks memory dramatically: category for repeated strings, int32/float32 where precision allows.
import numpy as np
import pandas as pd

n = 1_000_000
rng = np.random.default_rng(1)
df = pd.DataFrame({
    "model": rng.choice(["small", "large", "vision"], size=n),
    "tokens": rng.integers(1, 8000, size=n),
})
before = df.memory_usage(deep=True).sum() / 1e6

df["model"] = df["model"].astype("category")       # 3 distinct values -> small int codes
df["tokens"] = df["tokens"].astype("int32")        # max 8000 fits easily
after = df.memory_usage(deep=True).sum() / 1e6

print(f"{before:.0f} MB -> {after:.0f} MB")
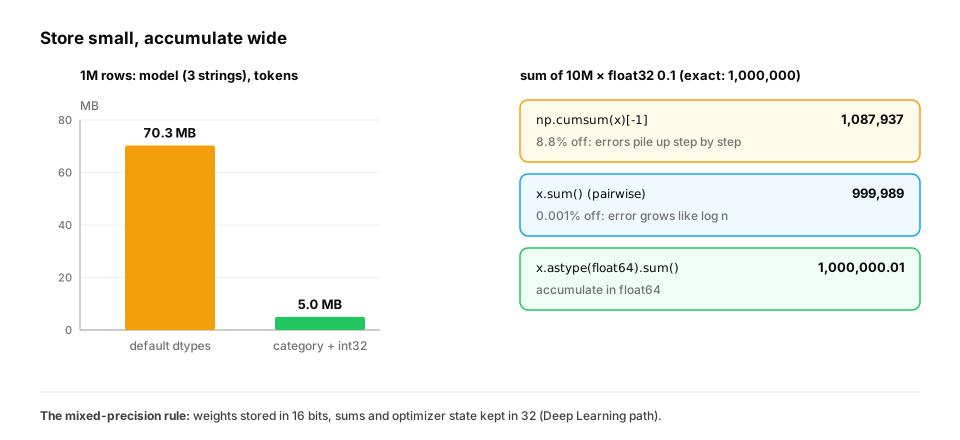
Measured: 70.3 MB down to 5.0 MB, 14× less, with identical results.
"Where precision allows" deserves a test. Add 0.1 ten million times; the exact answer is 1,000,000.
import numpy as np

x = np.full(10_000_000, 0.1, dtype=np.float32)
print(float(np.cumsum(x)[-1]))          # left to right:    1,087,937  (8.8% off)
print(float(x.sum()))                   # pairwise:           999,989  (0.001% off)
print(float(x.astype(np.float64).sum()))  # float64:        1,000,000.01
A float32 has about 7 significant digits. Once the running total is large, adding 0.1 to it rounds badly, and the error piles up step after step. np.sum avoids most of this by adding in a tree (pairwise summation), so errors grow with log n rather than n. Store in float32 if you like; accumulate long sums, losses and statistics in float64. The same rule reappears in mixed-precision training, where weights are stored in 16 bits but accumulated in 32.
From production
A metrics job keeps a running total of per-request latency in a float32 array with np.cumsum over a month of traffic (hundreds of millions of values). The reported mean drifts upward as the month goes on.
What's the most likely cause and fix?
Show the answer
B. cumsum adds left to right in float32, so rounding error grows with the running total; accumulate in float64 (or use np.sum's pairwise summation on chunks) — With ~7 significant digits, adding small values to a huge float32 total rounds every step, and the error compounds. Float64 accumulators, or pairwise or compensated summation, keep long-running statistics honest.
7. How it's done at scale
- Vector search. The
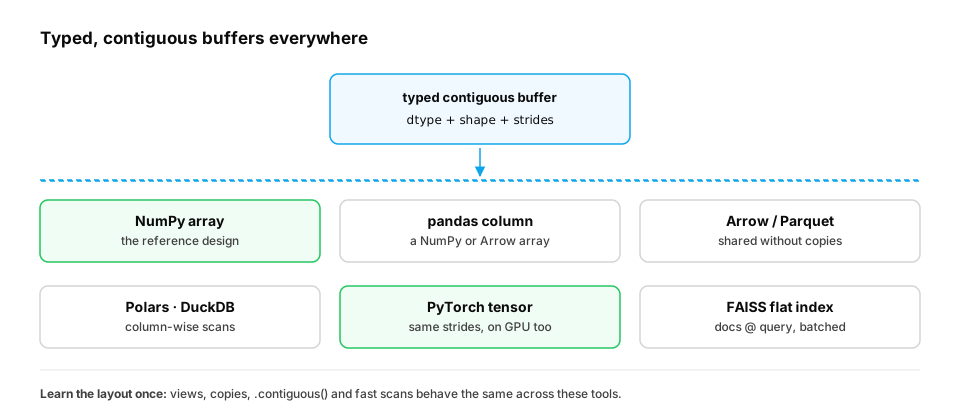
@plusargpartitionabove is exactly a "flat" (exact) index. FAISS, the library behind many production vector stores, runs this same computation in batches on GPUs, then adds approximate indexes (inverted lists and product quantization) when scanning every vector becomes too slow (Johnson, Douze and Jégou, 2017). - Columnar data. Pandas columns, Apache Arrow, Parquet, Polars and DuckDB all store a table column by column, one typed buffer each, for the reason shown in section 2: scans read contiguous memory. Arrow standardises that layout so tools can share data without copying (Arrow columnar format); pandas 2 can store columns as Arrow arrays (pandas: PyArrow functionality).
- Tensors. PyTorch tensors carry the same shape-and-strides description as NumPy arrays, which is why
.Tand.vieware free there too, and why.contiguous()exists.
From production
A team's exact vector search (one @ over all embeddings, then top-k) is fine at 1 million documents but too slow at 500 million.
What do production vector stores do at that scale?
Show the answer
A. Keep exact search for small collections, and switch to approximate indexes (inverted lists, product quantization, graph indexes) that score only a fraction of the vectors, often on GPUs — A flat index is the docs @ query + top-k you just wrote, exact and O(n) per query. FAISS and similar libraries add approximate structures that trade a little recall for orders-of-magnitude speed (Vector databases, in the RAG path).
8. Common misconceptions
- "Vectorized means parallel." Mostly not. Element-wise NumPy operations run on one core; the speed comes from skipping the interpreter, from SIMD and from the cache. Matrix multiplication is the exception, because BLAS libraries use threads.
- "
np.vectorizevectorizes my function." It is a loop with a nicer signature; its own documentation says it is provided for convenience, not performance. It measured slower than a plain loop above. - "
df.applyis the pandas way to avoid loops."apply(axis=1)is a Python loop over rows: 3,800× slower than the column expression above. - "Slicing makes a copy." Basic slices are views: writing to them changes the original. Fancy indexing and boolean masks copy. When unsure,
np.shares_memorytells you. - "
float32is always good enough." For storage, often. For long sums and statistics, measure first: the left-to-right sum above was 8.8% wrong.
From production
An analyst writes df[df['model'] == 'large']['cost'] = 0 to zero out large-model costs. The DataFrame is unchanged, and pandas prints a SettingWithCopyWarning.
Why, and what's the correct line?
Show the answer
C. The boolean filter returns a new DataFrame (a copy), so the assignment changes that temporary copy; use df.loc[df['model'] == 'large', 'cost'] = 0 — Boolean masks copy, so chained indexing assigns into a temporary object that's thrown away. .loc[rows, col] = value is a single indexing operation on the original DataFrame.
Further reading
- Harris et al., Array programming with NumPy, Nature 2020: the design of the array, written by its maintainers.
- van der Walt, Colbert and Varoquaux, The NumPy array: a structure for efficient numerical computation, 2011: strides, views and broadcasting explained from the memory layout up.
- NumPy documentation: Broadcasting and Copies and views.
- David Goldberg, What Every Computer Scientist Should Know About Floating-Point Arithmetic, 1991.
- Wes McKinney, Python for Data Analysis, 3rd edition, free online, by the creator of pandas.
Check yourself
- Why is a NumPy operation on an array faster than a Python loop over a list?
- Can you add a
(500, 3)array and a(3,)array? What happens? - What does
axis=0mean inX.mean(axis=0)? - Why can a pandas
mergesilently lose rows? - Why is transposing a large matrix instant, while copying the transpose into a new array is slow?
- Why can summing ten million
float32values left to right give an answer 9% off?
Answers
- The array is one contiguous block of raw numbers of one type, and the operation runs as compiled C (often SIMD) instead of going through the interpreter for every element.
- Yes: the
(3,)vector broadcasts across all 500 rows with a stride of 0, without being copied. - Aggregate down the rows, giving one value per column.
- The default is an inner join: rows without a match in the other table are dropped.
- Transposing only swaps the strides, so no data moves; copying reads the old matrix column by column, which wastes most of every cache line.
- A float32 keeps about 7 significant digits, so adding 0.1 to a large running total rounds every time and the errors accumulate; pairwise summation or float64 fixes it.
Exercise
You have a DataFrame of request logs with ts (seconds), user and latency. Compute, per user: the request count, the p95 latency, and the share of requests slower than 2 seconds. Then list users whose p95 is above 2 seconds. No Python loops over rows.
Solution
import numpy as np
import pandas as pd

rng = np.random.default_rng(42)
users = np.array(["asha", "ravi", "meera"])
logs = pd.DataFrame({
    "user": rng.choice(users, size=3000, p=[0.5, 0.3, 0.2]),
    "latency": rng.gamma(shape=2.0, scale=0.4, size=3000),
})
logs.loc[logs["user"] == "ravi", "latency"] *= 2.5      # ravi is on a slow region

stats = logs.groupby("user")["latency"].agg(
    requests="size",
    p95=lambda s: s.quantile(0.95),
    slow_share=lambda s: (s > 2.0).mean(),
)
print(stats.round(3))
print("p95 above 2s:", stats.index[stats["p95"] > 2.0].tolist())
(s > 2.0).mean() works because True counts as 1 and False as 0, so the mean is the share of slow requests. Named aggregations (requests=...) give readable column names. Only Ravi crosses a 2-second p95.
This unlocks:
- Profiling — measuring where the time goes, before and after vectorizing.
- PyTorch engineering — tensors are NumPy arrays that can live on a GPU and track gradients.