You already know: nothing yet — this is the first lesson. You only need to have written a few lines of Python.
What we're building: Atlas, the AI tutor we grow across the whole course, starts as a Python program. Before Atlas can do anything clever, we need to understand what Python actually does with our code — because that decides how fast and how memory-hungry Atlas will be.
1. From your code to the CPU
The question. A CPU only understands tiny instructions like "add these two numbers". How does total = price * qty become something a CPU can run?
Start from nothing. A CPU executes machine instructions: load a value, add, store, jump. Languages like C are translated straight into those instructions ahead of time (compiled). Python takes a different route with two steps:
- Compile to bytecode. When you run a file, CPython (the standard Python) first translates it into bytecode — a list of simple, made-up instructions such as "load this variable" or "multiply the top two values".
- Interpret the bytecode. A program called the interpreter — a big loop written in C — reads one bytecode instruction at a time and carries it out.
So your CPU is not running your Python code. It's running the interpreter, which is reading your code. That extra layer is the main reason plain Python is slower than C.
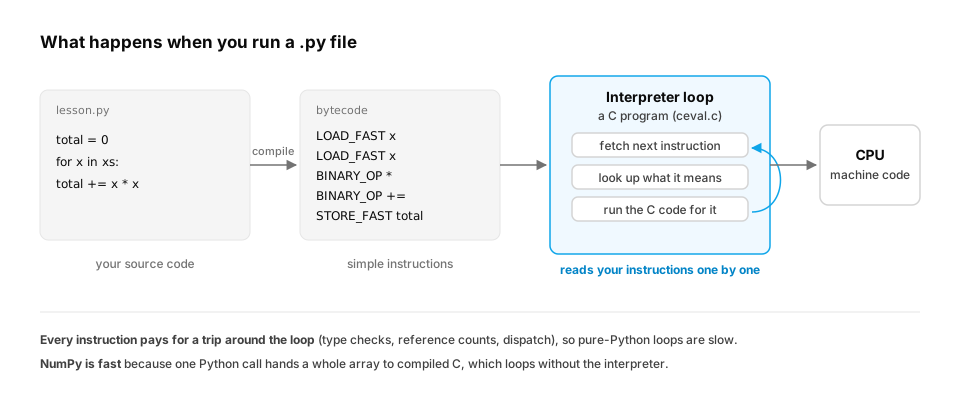
Real-life analogy. A chef (CPU) who only reads French, and a recipe (your code) in English. Python hands the chef an interpreter who reads each English line aloud in French as the chef cooks.
| Analogy | Technical |
|---|---|
| English recipe | Python source |
| Simplified recipe cards | Bytecode |
| Interpreter reading cards aloud | CPython's evaluation loop |
| Chef | CPU |
Where it breaks: a real interpreter also keeps a lot of bookkeeping (types, reference counts) that a human translator wouldn't.
Worked example. Look at the bytecode for a one-line function:
import dis

def cost(price, qty):
    return price * qty

dis.dis(cost)
You'll see instructions like LOAD_FAST price, LOAD_FAST qty, BINARY_OP (*) and RETURN_VALUE (exact names vary slightly between Python versions). Four small steps for one line — and the interpreter does work around each of them.
Common traps
- "Python is interpreted, so it isn't compiled." It is compiled — to bytecode, not machine code. That's what the
__pycache__/*.pycfiles are. - "Python is slow, full stop." Plain Python loops are slow; Python calling into fast C code (NumPy, PyTorch) is not. Section 3 shows why.
The first optimisation: move the loop into C. You don't need NumPy to see the interpreter's cost. Python's own built-ins (sum, max, sorted, "".join, collections.Counter) run their loops in C. Replacing a hand-written loop with a built-in removes the per-item bytecode work:
import time

tokens_per_doc = list(range(2_000_000))

t = time.perf_counter()
total = 0
for n in tokens_per_doc:          # the interpreter runs ~4 bytecodes per item
    total += n
loop = time.perf_counter() - t

t = time.perf_counter()
total2 = sum(tokens_per_doc)      # one call; the loop runs inside C
builtin = time.perf_counter() - t

assert total == total2
print(f"Python loop: {loop * 1000:.0f} ms | built-in sum: {builtin * 1000:.0f} ms")
print("built-in at least 3x faster:", loop / builtin >= 3)
On the machine used to check this lesson, the loop took 89 ms and sum took 7 ms, about 13× faster for identical results. Your numbers will differ, but the built-in wins every time. It's the same data, the same Python objects, and fewer trips through the interpreter loop.
In production / interviews. Profiling an ML service usually shows time spent in Python glue (data loading, tokenizing, pre/post-processing) rather than in the model. Interview question: "Why can a Python loop over a million numbers be 50× slower than the same operation in NumPy?"
From production
A colleague says: 'Python is interpreted, so our 40-second preprocessing step can't be sped up without rewriting it in C++.' The step is a Python for-loop that sums and counts values in lists.
What's the best first move?
Show the answer
C. Replace the hand-written loops with built-ins (sum, Counter, sorted) or NumPy, so the per-item loop runs in compiled code — The cost is per-item bytecode dispatch in the interpreter loop. Built-ins and NumPy run the same loop in C. Threads won't help CPU-bound pure-Python code (section 4).
2. Everything is an object
The question. In C, the number 5 takes 4 or 8 bytes. How big is it in Python?
Start from nothing. Python lets any variable hold any type, and you can ask any value what type it is. To make that possible, every value — even 5 — is stored as a full object in memory with a header:
- a reference count (how many names point to it),
- a pointer to its type (so Python knows it's an
int), - then the value itself.
A variable is just a name that points to an object. a = 5; b = a doesn't copy anything — both names point at the same object.
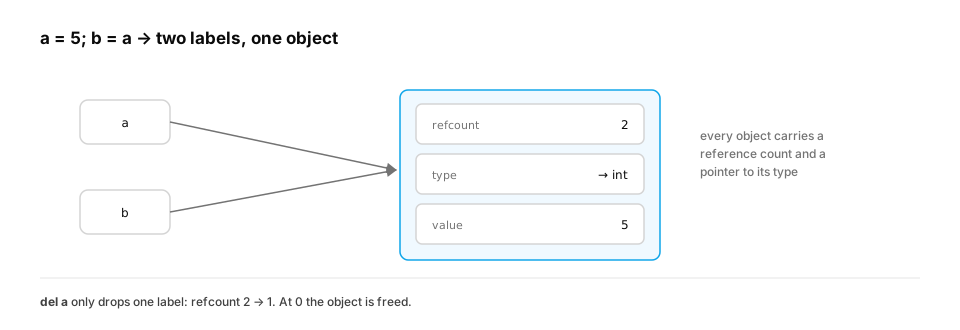
Real-life analogy. A labelled parcel in a warehouse. The parcel has a shipping label (type), a counter of how many orders reference it (refcount), and the item inside (value). Variable names are order slips pointing to the parcel.
Worked example.
import sys

x = 1000
print(sys.getsizeof(x))        # 28 bytes for a small int on 64-bit CPython
y = x
print(x is y)                  # True: two names, one object
print(sys.getsizeof(1.5))      # 24 bytes for a float
print(sys.getsizeof("a"))      # ~50 bytes for a one-character string
A machine integer is 8 bytes; a Python int is about 28. That's the price of flexibility.
When does memory get freed? When an object's reference count drops to zero, CPython frees it immediately. A separate garbage collector occasionally cleans up groups of objects that point to each other in a cycle (whose counts never reach zero on their own).
Math (bookkeeping, not calculus). Memory for n separate Python ints ≈ n × (28 + 8) bytes: 28 for each object plus 8 for each pointer to it in a list. For n = 1,000,000: about 36 MB, versus 8 MB for a packed array of 64-bit integers.
Common traps
isvs==:isasks "same object?",==asks "same value?". Use==for values.- Mutable defaults:
def f(x=[])shares one list across all calls, because the default object is created once.
In production / interviews. Memory blow-ups in data pipelines often come from millions of small Python objects (dicts per row, lists of floats). The fix is usually a columnar format: NumPy arrays, Arrow, or Pandas columns.
When you do need millions of objects: __slots__. Each regular instance carries its own __dict__, a whole hash table per object, so attributes can be added at any time. If a class has fixed fields, __slots__ stores them in fixed positions instead:
import sys

class Event:
    def __init__(self, user, ts, kind):
        self.user, self.ts, self.kind = user, ts, kind

class SlimEvent:
    __slots__ = ("user", "ts", "kind")       # fixed fields, no per-object __dict__
    def __init__(self, user, ts, kind):
        self.user, self.ts, self.kind = user, ts, kind

e, s = Event("asha", 1700000000, "click"), SlimEvent("asha", 1700000000, "click")
regular = sys.getsizeof(e) + sys.getsizeof(e.__dict__)
slim = sys.getsizeof(s)
print(f"regular object: {regular} bytes | with __slots__: {slim} bytes")
print(f"for 10 million events: {regular * 1e7 / 1e9:.1f} GB vs {slim * 1e7 / 1e9:.1f} GB (objects only)")
try:
    s.usr = "typo"
except AttributeError as err:
    print("AttributeError:", err)
On Python 3.9, a regular instance plus its __dict__ is 152 bytes, and the slotted one is 56 bytes. For 10 million events that's 1.5 GB vs 0.6 GB, before counting the field values. Exact sizes vary by Python version, and newer versions have shrunk instance dicts. Slots also catch typos: setting s.usr raises AttributeError instead of silently creating a new attribute. @dataclass(slots=True) (Python 3.10+) gives the same result with less typing (Classes and types).
From production
An in-memory feature cache holds 20 million small Python objects, each with 4 fixed attributes, and the worker is being OOM-killed.
Which change most directly cuts per-object memory without changing the data model?
Show the answer
D. Use __slots__ (or dataclass(slots=True)) so each object stops carrying its own __dict__, or move the data into columnar arrays — Each regular instance has a per-object dict. Slots store fixed fields directly, often cutting object size by more than half. For pure numeric data, NumPy/Arrow columns cut it further. gc.collect() doesn't free objects that are still referenced.
3. Why NumPy is fast: packing data together
The question. Why is np.sum(arr) dramatically faster than sum(list_of_numbers)?
Start from nothing. A Python list of numbers is a row of pointers, each leading to a separate int object somewhere in memory. Summing it means, for every element: follow the pointer, check the type, unpack the value, add, and create a new result object.
A NumPy array stores raw numbers side by side in one block of memory, all the same type. Summing it is one call into compiled C code that streams through that block. The CPU loves this: it loads memory in chunks (cache lines), so neighbouring numbers arrive almost for free.
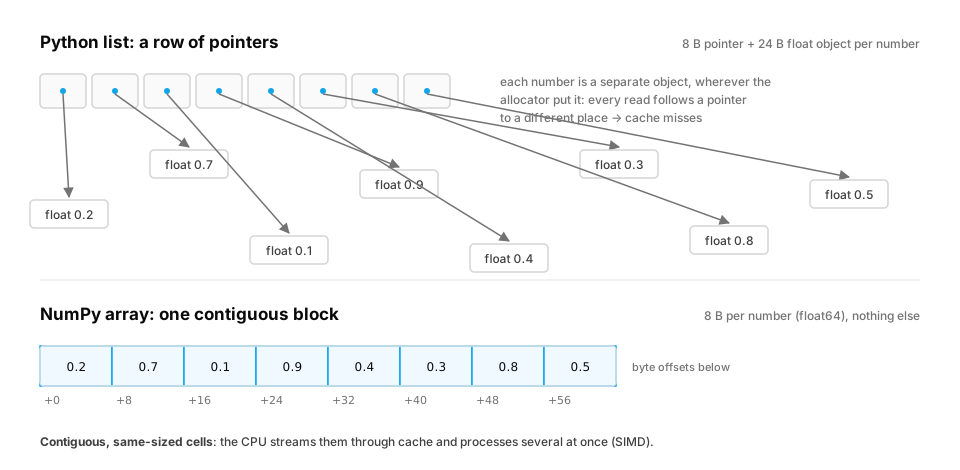
Real-life analogy. Shipping a thousand items as a thousand separate envelopes, each with its own address label, versus packing them into one container.
Worked example.
import sys
import time
import numpy as np

n = 1_000_000
py_list = list(range(1000, 1000 + n))          # avoid Python's cache of small ints
arr = np.arange(1000, 1000 + n, dtype=np.int64)

list_bytes = sys.getsizeof(py_list) + sum(sys.getsizeof(v) for v in py_list)
print(f"list : {list_bytes / 1e6:.0f} MB")      # ~36 MB
print(f"numpy: {arr.nbytes / 1e6:.0f} MB")      # 8 MB

t = time.perf_counter(); s1 = sum(py_list); t_list = time.perf_counter() - t
t = time.perf_counter(); s2 = int(arr.sum()); t_np = time.perf_counter() - t
assert s1 == s2
print(f"sum speed-up with NumPy: ~{t_list / t_np:.0f}x")
Typical results: about 4–5× less memory and 10–100× faster, depending on your machine.
Vectorization means writing the operation on the whole array (arr * 2 + 1) instead of a Python loop. The loop still happens — but in C, without per-element Python overhead.
Common traps
- Looping over a NumPy array element by element in Python (
for v in arr:) throws away the speed-up. - Mixing types (
np.array([1, "a"])) silently creates a slowobjectarray or converts everything to strings.
In production / interviews. This is why every ML library has the same shape: a Python API on top of packed tensors processed by C++/CUDA. PyTorch tensors are the same idea as NumPy arrays, with a GPU option.
From production
A feature pipeline computes [x * 0.5 + 1 for x in arr] where arr is a 50-million-element NumPy array, and it is slower than expected.
What's wrong?
Show the answer
B. Iterating in Python turns each element back into a Python object, losing the speed-up; write arr * 0.5 + 1 so the loop runs in C — A Python-level loop over a NumPy array boxes every element into a Python float and runs the interpreter per item. Vectorised expressions run one compiled loop over the packed buffer.
4. The GIL: one Python thread at a time
The question. If my machine has 8 cores, why doesn't adding threads make my Python code 8× faster?
Start from nothing. Reference counts (section 2) change constantly. If two threads updated the same count at the same time, they could corrupt it and free memory still in use. CPython's simple fix is the Global Interpreter Lock (GIL): in the standard build, only one thread executes Python bytecode at any moment.
But the GIL is released whenever a thread waits — for the network, a disk read, or time.sleep — and many C libraries (including much of NumPy) release it during heavy computation. So:
| Work type | Example | Best tool |
|---|---|---|
| Waiting on I/O | Calling an LLM API, reading files | threading or asyncio |
| Pure-Python CPU work | Tokenizing text in a Python loop | multiprocessing (separate processes, separate GILs) |
| Number crunching | Matrix maths | NumPy/PyTorch (already in C, often parallel) |
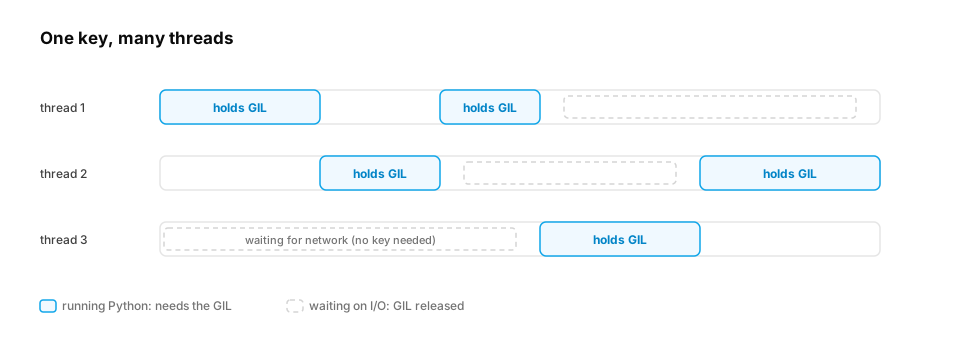
Real-life analogy. A kitchen with one shared knife. Cooks can all wait for ovens at the same time, but only one can chop at a time. To chop in parallel, open a second kitchen (a second process).
Worked example. Threads speed up waiting, not computing:
import time
from concurrent.futures import ThreadPoolExecutor

def fake_api_call(i):
    time.sleep(0.2)        # waiting releases the GIL
    return i

start = time.perf_counter()
with ThreadPoolExecutor(max_workers=10) as pool:
    results = list(pool.map(fake_api_call, range(10)))
elapsed = time.perf_counter() - start
print(f"10 calls of 0.2s took {elapsed:.2f}s")   # ~0.2s, not 2s
Note. Python 3.13 introduced an optional free-threaded build without the GIL. It's still opt-in, and the standard build keeps the GIL, so the rules above are what you'll meet in most production code today.
Common traps
- Using threads for CPU-heavy pure-Python work, then wondering why it isn't faster.
- Using
multiprocessingfor tiny tasks: starting processes and copying data costs more than the work.
In production / interviews. LLM apps spend most of their time waiting on model APIs, so asyncio is the default for serving (FastAPI is built on it). Interview question: "You have 1,000 prompts to send to an API. How do you make it fast, and how do you avoid hitting the rate limit?"
The example prints about 0.2s for ten 0.2-second waits. The waits overlapped because each sleeping thread released the GIL. The next lesson (The GIL and concurrency) measures the CPU-bound case too, where threads give almost nothing back.
From production
A team parallelises a pure-Python tokenisation loop with 8 threads on an 8-core machine. It gets no faster.
What explains it, and what would help?
Show the answer
A. Only one thread runs Python bytecode at a time under the GIL, so CPU-bound Python doesn't parallelise with threads; use processes (or a tokenizer implemented in Rust/C that releases the GIL) — Threads help when work waits on I/O. For pure-Python CPU work, separate processes each get their own interpreter and GIL. Libraries that do the heavy loop in native code (e.g. Rust-based tokenizers) can also release the GIL and use many cores.
5. Reaching native code: how PyTorch runs on a GPU from Python
The question. If Python is the slow part, how does torch.matmul run at full GPU speed?
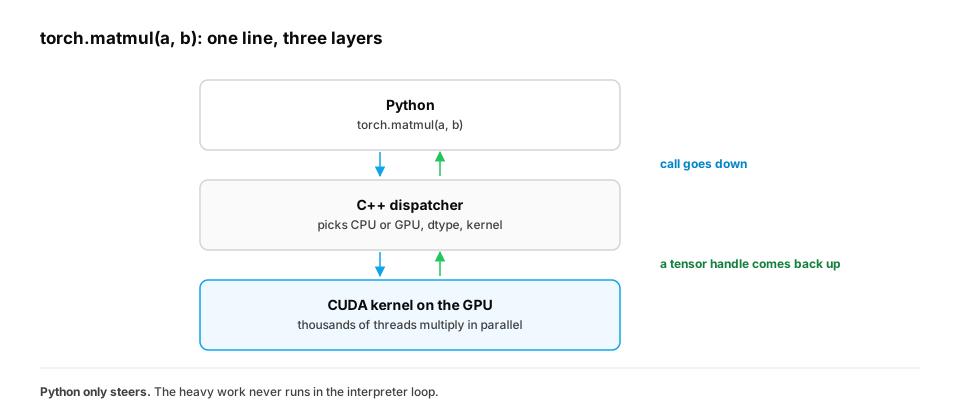
Start from nothing. Python can call functions written in C or C++ through extension modules — compiled libraries that look like normal Python modules. When you call torch.matmul(a, b):
- Python calls into PyTorch's C++ core (one cheap call).
- PyTorch checks the tensors' type and device and picks the right implementation (dispatch).
- For a GPU tensor, it launches a CUDA kernel: thousands of GPU threads multiply the matrices.
- Python gets back a new tensor object that points to the result in GPU memory.
Python does a handful of steps; the GPU does billions of multiply-adds. That ratio is why Python is fine as the "steering wheel" of AI.
Real-life analogy. A manager (Python) signs one work order; a factory floor (C++/GPU) does the work.
Worked example. The same "call native code" idea, using ctypes to call the C standard library directly:
import ctypes
import ctypes.util

libc = ctypes.CDLL(ctypes.util.find_library("c"))
libc.abs.argtypes = [ctypes.c_int]
libc.abs.restype = ctypes.c_int
print(libc.abs(-42))   # 42, computed by C code, called from Python
Real ML libraries use more convenient tools (pybind11, Cython, PyTorch C++ extensions), but the idea is the same: Python calls a compiled function.
Common traps
- Calling many tiny GPU operations from a Python loop: each call has overhead, so batch work into larger tensor operations.
- Moving data between CPU and GPU (
.cpu(),.item()) inside a loop. Each move forces a wait for the GPU.
In production / interviews. "Why is my GPU only 30% busy?" often means the Python side can't feed it fast enough: slow data loading, too many small kernels, or frequent CPU↔GPU copies. Tools like torch.compile and CUDA graphs reduce the Python overhead.
From production
A preprocessing loop over 10 million floats in pure Python takes 9 seconds; the same operation with NumPy takes 0.03 seconds.
What is the main reason for the 300x difference?
Show the answer
A. Each Python float is a separate heap object handled by the interpreter one at a time, while NumPy stores raw values contiguously and runs one compiled loop over them — Interpreter dispatch, boxing and pointer chasing per element dominate pure-Python loops; NumPy's packed arrays let one C loop (often SIMD) process everything.
Check yourself
- Recall: What two steps does CPython take to run a
.pyfile? - Apply: You need to make 500 slow HTTP calls to a model API. Threads, processes or a NumPy rewrite?
- Predict: About how many MB does a Python list of 2 million distinct large ints use, roughly?
Answers
- Compile the source to bytecode, then run the bytecode in the interpreter loop.
- Threads or
asyncio— the work is waiting, which releases the GIL. - About 2,000,000 × (28 + 8) bytes ≈ 72 MB.
Exercise
Build profile_memory(values) that reports the memory of a list of numbers as (a) a Python list and (b) a NumPy array, and the ratio between them. Then explain in two sentences why the ratio is close to 4.5 for large ints but different for floats (sys.getsizeof(1.5) is 24 bytes).
Solution
import sys
import numpy as np

def profile_memory(values):
    as_list = sys.getsizeof(values) + sum(sys.getsizeof(v) for v in values)
    as_array = np.asarray(values).nbytes
    return as_list, as_array, as_list / as_array

ints = list(range(1000, 101_000))
floats = [v + 0.5 for v in ints]
for name, vals in [("ints", ints), ("floats", floats)]:
    lst, arr, ratio = profile_memory(vals)
    print(f"{name}: list {lst/1e6:.1f} MB, array {arr/1e6:.1f} MB, ratio {ratio:.1f}x")
Each list element costs one 8-byte pointer plus its object (28 bytes for these ints, 24 for floats), while the array stores 8 bytes per value. So the ratio is about (8 + 28) / 8 ≈ 4.5 for ints and (8 + 24) / 8 = 4 for floats.
This unlocks:
- C++ & memory management — what "packed memory" and "pointers" look like when you control them yourself.
- Data structures for AI — choosing layouts on purpose.
- D2 Linear algebra — vectors and matrices are these packed arrays.
Sources: Python docs — dis, sys.getsizeof, threading, "Python support for free threading" (3.13); NumPy user guide — "The N-dimensional array"; PyTorch docs — "Extending PyTorch".