The incident. A team spends two sprints rewriting their tokenizer wrapper in Rust to speed up a RAG endpoint. Latency barely moves. When someone finally runs a profiler, 70% of the time is in a function that re-reads a 40 MB YAML config file on every request. The fix is one line of caching, and it takes ten minutes.
You already know: decorators and lru_cache (Decorators and context managers); vectorization (NumPy and pandas); tests (Errors, logging and tests).
1. Measure first: timeit
The question. How do you reliably compare two ways of writing the same thing?
Start from nothing. A single timing is noisy: other programs, CPU frequency changes and caches all interfere. timeit runs a snippet many times and reports the total; take the best of several repeats, since slower runs are mostly noise. Always compare candidates in the same run, on the same data.
import timeit

setup = "words = [f'w{i}' for i in range(10_000)]"
candidates = {
    "+= in a loop": "s = ''\nfor w in words: s += w",
    "''.join":      "s = ''.join(words)",
    "list in":      "'w9999' in words",
    "set in":       "'w9999' in ws",
}
for label, stmt in candidates.items():
    full_setup = setup + "\nws = set(words)"
    best = min(timeit.repeat(stmt, setup=full_setup, number=200, repeat=5))
    print(f"{label:<14} {best / 200 * 1e6:10.2f} µs per run")
join beats +=, and the set lookup is thousands of times faster than the list scan, matching the earlier lessons. In a notebook, %timeit does the same with one line.
Key idea. Don't guess where the time goes. Programmers' intuition about bottlenecks is wrong surprisingly often. Measure, change one thing, measure again.
Benchmarks vs services: best-of-N vs percentiles. timeit's minimum is right for comparing two snippets of code. A running service is different: you care about what real users experience, including the slow requests. The mean hides those, so production dashboards report percentiles: p50 (the median), p95 and p99.
import random, statistics

random.seed(11)
latencies = [random.gauss(120, 15) for _ in range(9_800)]          # normal requests, ms
latencies += [random.uniform(1500, 4000) for _ in range(200)]       # 2% hit a cold cache or a retry

def pct(values, p):
    s = sorted(values)
    return s[min(len(s) - 1, int(p / 100 * len(s)))]

print(f"mean {statistics.mean(latencies):6.0f} ms")
for p in (50, 95, 99):
    print(f"p{p:<3} {pct(latencies, p):6.0f} ms")
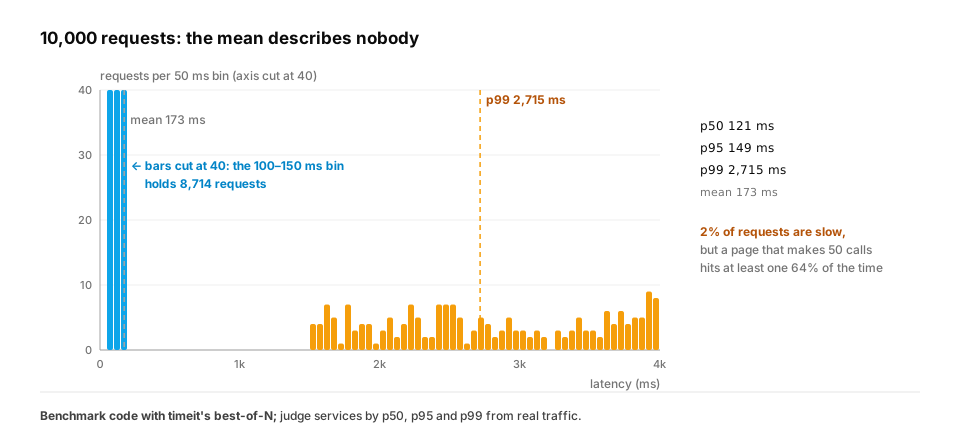
The mean is 173 ms, a latency almost no request actually had. The median (p50) is 121 ms and p95 is 149 ms, so 95% of users are fine. p99 is 2715 ms, which exposes the 2% of requests that hit a cold cache or a retry. That tail matters more than it sounds: a page that makes 50 backend calls hits at least one slow call about 64% of the time (1 − 0.98⁵⁰).
In production. Service-level objectives (SLOs) are written in percentiles, for example "p99 latency under 1 second over 30 days", and monitoring tools compute them from histograms of real traffic. For LLM endpoints, teams usually track time to first token and total latency separately, both as percentiles. Benchmark with best-of-N to compare code; operate with percentiles to protect users.
From production
After a cache change, the mean latency of an endpoint drops from 180 ms to 150 ms, and the team celebrates. Support tickets about 'the app freezing' go up.
What should the team have looked at?
Show the answer
D. The p95/p99 percentiles: the change may have improved typical requests while making the slow tail much worse — A mean can fall while the tail grows, for example when most requests get faster but cache misses get much slower. Percentiles show what the slowest users experience, which is what drives complaints.
2. Where does the time go? cProfile
The question. In a real program with hundreds of functions, which one is slow?
Start from nothing. A profiler records every function call and how long it took. cProfile (built in) reports two key numbers per function:
- tottime: time spent in the function's own code.
- cumtime: time including everything it called.
Sort by cumulative time to find the expensive branch, then by tottime to find the hot code inside it. Here's the incident in miniature:
import cProfile, pstats, io, json, time

CONFIG_TEXT = json.dumps({f"key{i}": list(range(50)) for i in range(2000)})

def load_config():
    return json.loads(CONFIG_TEXT)          # the "re-read the config" bug

def tokenize(text):
    return text.lower().split()

def handle_request(question):
    config = load_config()                  # runs on EVERY request
    tokens = tokenize(question)
    return len(tokens) + len(config)

profiler = cProfile.Profile()
profiler.enable()
for _ in range(200):
    handle_request("What is the refund policy for annual plans?")
profiler.disable()

out = io.StringIO()
pstats.Stats(profiler, stream=out).strip_dirs().sort_stats("cumulative").print_stats(5)
report = out.getvalue()
print("\n".join(line for line in report.splitlines() if "ncalls" in line or ".py:" in line))
The report shows load_config (and the json decoding inside it) taking almost all of the cumulative time, with nearly all of it spent inside the JSON decoder (the tottime column), while tokenize doesn't even make the top five. Exactly the ten-minute fix the team missed. From the command line: python -m cProfile -s cumtime app.py.
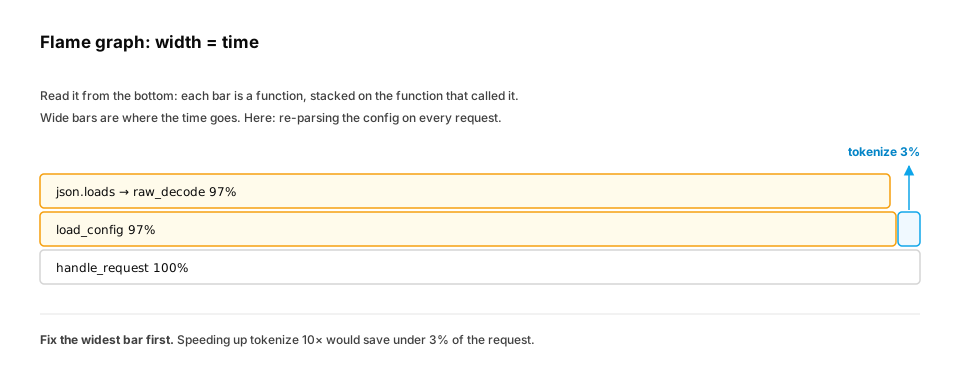
In production. Sampling profilers like py-spy attach to a running process without code changes and with almost no overhead, and draw flame graphs: wide bars are where time goes. That's how you profile a live server at 2 a.m.
From production
A profile of a slow endpoint shows handle() with cumtime 2.0s and tottime 0.01s, and fetch_user_history() (called from handle) with cumtime 1.8s.
Where should you look first?
Show the answer
C. fetch_user_history(): it accounts for 90% of the cumulative time — handle() itself does almost no work (tiny tottime); its time is in what it calls. fetch_user_history owns 1.8 of the 2.0 seconds, so it's the only place a fix can matter much (Amdahl's law).
3. Memory: tracemalloc
The question. Why does this process's memory keep growing?
Start from nothing. Slow is one problem; memory growth is the other, and in containers it ends in an OOMKill. tracemalloc (built in) records where memory is allocated. Take a snapshot before and after a suspicious step, then compare them by source line.
import tracemalloc

CACHE = {}

def answer(question):
    result = question.upper() * 50
    CACHE[question] = result               # unbounded cache: grows forever
    return result

tracemalloc.start()
before = tracemalloc.take_snapshot()
for i in range(20_000):
    answer(f"question number {i}")
after = tracemalloc.take_snapshot()

top = after.compare_to(before, "lineno")[0]
print(f"grew {top.size_diff / 1e6:.1f} MB at line {top.traceback[0].lineno}: {top.count_diff} new blocks")
current, peak = tracemalloc.get_traced_memory()
print(f"current {current / 1e6:.1f} MB, peak {peak / 1e6:.1f} MB")
tracemalloc.stop()
The biggest growth points at the line that builds result, whose strings stay alive because CACHE holds them. The fix is a bounded cache (lru_cache(maxsize=...)) or a TTL. Memory leaks in Python are almost always references you forgot you kept: global caches, lists of history, closures.
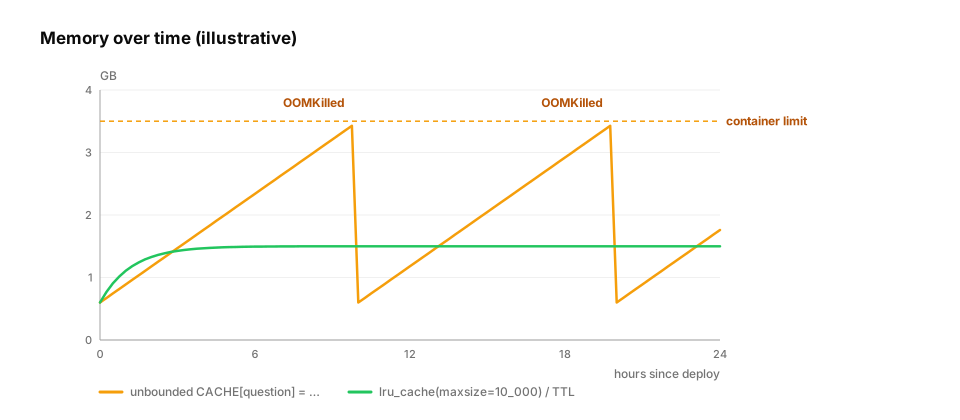
What a leak looks like from the outside. In production you rarely see the leak itself. You see its shape on a memory dashboard: a steady ramp, a sudden drop when the container is killed and restarted, then the same ramp again. Restarts "fix" it, which is why leaks can survive for months. A healthy cache has a different shape: it climbs while warming up, then flattens once it's full and starts evicting.
In production. Beyond
tracemalloc, sampling tools such as memray (from Bloomberg) and py-spy can show allocations in a running process. In ML services, the usual leak suspects are caches keyed on every distinct prompt, lists that keep every past request "for debugging", and tensors kept alive by accident. Keeping a reference to a loss tensor that still has its computation graph keeps that whole graph's memory alive (PyTorch engineering).
From production
A FastAPI service's memory climbs ~200 MB per hour until Kubernetes kills it. Restarting 'fixes' it for a while.
What's the most effective first step?
Show the answer
B. Snapshot with tracemalloc (or a heap profiler) at two points in time and compare by line to see which allocations keep growing — Steady growth means something keeps references, usually a cache, a list or a global. Comparing snapshots points at the exact line. More memory only delays the crash, and gc.collect() can't free objects that are still referenced.
4. The optimisation ladder
The question. Once you've found the slow part, what do you try, and in what order?
Start from nothing. Climb from the cheapest, biggest wins to the most expensive:
- Don't do it at all: remove repeated work, cache results (with a bound), load once at startup.
- Better algorithm or data structure: a set instead of a list, a dict instead of a scan, O(n) instead of O(n²).
- Batch and overlap I/O: one query instead of N, concurrent API calls (next lesson).
- Vectorize: NumPy, pandas, PyTorch instead of Python loops.
- Compiled code: Numba, Cython or a Rust/C++ extension, only for a proven hot loop.
import time
from functools import lru_cache

def load_config_slow():
    time.sleep(0.01)                        # stands in for parsing a big file
    return {"model": "small"}

@lru_cache(maxsize=1)
def load_config_cached():
    return load_config_slow()

for loader in (load_config_slow, load_config_cached):
    start = time.perf_counter()
    for _ in range(100):
        loader()
    print(f"{loader.__name__:<20} {time.perf_counter() - start:.2f}s for 100 requests")
Step 1 alone takes 100 requests from about 1 second to about 0.01 seconds. The team in the incident went straight to step 5 and skipped the one that mattered.
Why the profile decides the rung: Amdahl's law. Speeding up one part of a program can only help as much as that part's share of the total time:
def amdahl(fraction, speedup):
    """Overall speed-up when `fraction` of the run time gets `speedup` times faster."""
    return 1 / ((1 - fraction) + fraction / speedup)

for fraction in (0.7, 0.2):
    for speedup in (10, 1000):
        print(f"{fraction:.0%} of the time, made {speedup:>4}x faster -> whole request {amdahl(fraction, speedup):.2f}x faster")
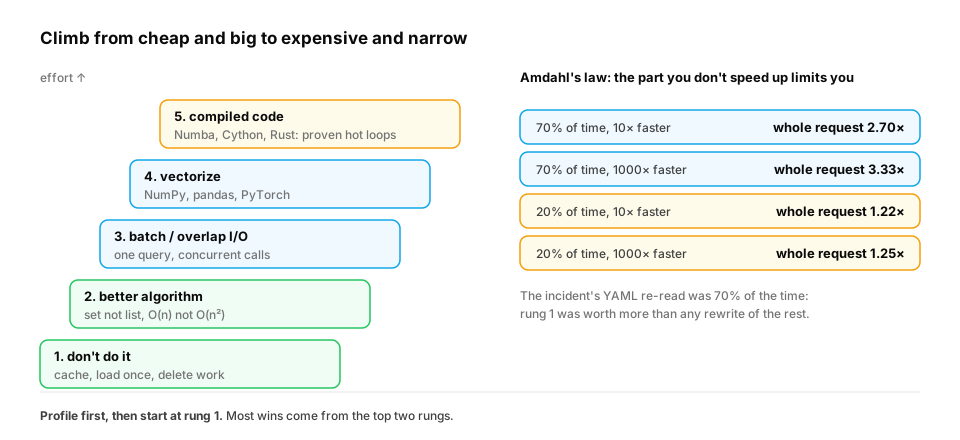
If the hot part is 70% of the request, making it 10× faster gives 2.70x overall, and even 1000× gives only 3.33x, because the other 30% is untouched. If the part you optimised was only 20% of the time, the ceiling is 1.25x no matter how heroic the rewrite. That's the arithmetic behind the incident: the tokenizer rewrite targeted a small slice of the time, while the YAML re-read was most of it.
In production. The same reasoning drives LLM latency work. If a RAG request spends 85% of its time waiting for the model to generate, shaving the retrieval step from 80 ms to 20 ms barely shows in end-to-end latency. Streaming the first tokens sooner, generating fewer tokens, or caching repeated prompts moves the number users actually feel. Always attribute time per stage first (Inference measurement and capacity).
From production
A profile shows a request spending 15% of its time in a Python JSON-formatting helper and 80% waiting on a model API call. An engineer proposes rewriting the helper in Rust for a 20× speed-up.
What's the best upper bound on the whole-request improvement from that rewrite alone?
Show the answer
A. About 1.17× faster: the other 85% of the time is unchanged — Amdahl: 1 / (0.85 + 0.15/20) ≈ 1.17. With 80% of the time in the model call, work on that part (fewer output tokens, caching, streaming, a smaller model) has far more leverage.
Check yourself
- Why take the minimum of several
timeitrepeats? - What's the difference between tottime and cumtime?
- What does comparing two tracemalloc snapshots tell you?
- What's the first rung of the optimisation ladder?
- Why do service dashboards show p95 and p99 rather than the mean?
- If a function takes 25% of a request's time, what is the most the whole request can speed up by optimising only that function?
Answers
- Noise only ever makes runs slower, so the fastest run is the closest to the code's true cost.
- tottime is time in the function's own code; cumtime includes all the functions it calls.
- Which source lines allocated memory between the two points, and how much, which points at what keeps growing.
- Avoid the work entirely: remove repeated work or cache it.
- A few very slow requests barely move the mean but hurt real users. Percentiles show the experience of the slowest 5% or 1%.
- At most 1 / 0.75 ≈ 1.33×, even if the function became instant (Amdahl's law).
Exercise
The function below finds pairs of near-duplicate questions. Profile it, find the bottleneck, and make it at least 20× faster on 3,000 questions while returning the same pairs.
Solution
import time

def normalise(q):
    return " ".join(q.lower().split())

def dupes_slow(questions):
    pairs = []
    for i in range(len(questions)):
        for j in range(i + 1, len(questions)):           # O(n²) comparisons
            if normalise(questions[i]) == normalise(questions[j]):
                pairs.append((i, j))
    return pairs

def dupes_fast(questions):
    seen, pairs = {}, []
    for i, q in enumerate(questions):
        key = normalise(q)                               # normalise each question once
        for j in seen.get(key, []):
            pairs.append((j, i))
        seen.setdefault(key, []).append(i)               # O(1) dict lookup instead of a scan
    return pairs

questions = [f"How do I reset password {i % 1500}?" for i in range(3000)]
questions[10] = "  how DO i reset   password 10? "

start = time.perf_counter(); slow = dupes_slow(questions); t_slow = time.perf_counter() - start
start = time.perf_counter(); fast = dupes_fast(questions); t_fast = time.perf_counter() - start
print(f"slow {t_slow:.2f}s, fast {t_fast * 1000:.1f} ms, {t_slow / t_fast:.0f}x faster")
assert sorted(slow) == sorted(fast)
print(len(fast), "pairs, identical results")
A profile of dupes_slow shows normalise called about 9 million times: it's inside the O(n²) double loop. The fix climbs two rungs at once: normalise each question once (avoid repeated work), and group by a dict key (a better data structure), turning O(n²) into O(n).
This unlocks:
- Async Python for LLM workloads — when the profile says "waiting on the network", concurrency is the fix.
- Interview prep and capstone — explaining complexity and measuring it is a core interview skill.